allisoncheri
nerd.(all original work CC BY-NC-SA)
101 posts
Latest Posts by allisoncheri
A short list of realizations from tonight’s photo sorting/editing session:
I have taken a truly astonishing number of photos of hockey players making ridiculous faces.
Over half of these involve tongues. So many that I literally made a Lightroom tag called ‘put that thing back in your mouth’.
Evidence points to the Carolina Hurricanes system requiring players to stick said tongue out when making a shot.
We could probably power Canada with Jeff Skinner’s grin. Someone should get on that.

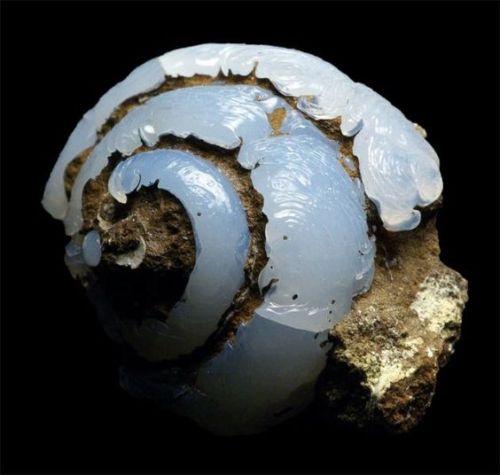
“My grandmother wove in me a tapestry that was impossible to unwind,” Vigo said. “Since then, I’ve dedicated my life to the sea, just as those who have come before me.”
Like the 23 women before her, Vigo has never made a penny from her work. She is bound by a sacred ‘Sea Oath’ that maintains that byssus should never be bought or sold.
Instead, Vigo explained that the only way to receive byssus is as a gift. […]
“Byssus doesn’t belong to me, but to everyone,” Vigo asserted. “Selling it would be like trying to profit from the sun or the tides.”
More recently, a Japanese businessman approached Vigo with an offer to purchase her most famous piece, ‘The Lion of Women’, for €2.5 million. It took Vigo four years to stitch the glimmering 45x45cm design with her fingernails, and she dedicated it to women everywhere.
“I told him, ‘Absolutely not’,” she declared. “The women of the world are not for sale.”
So, our physics teacher has the strange idea of motivating his students by letting each of us present a physical phenomenal we find interesting to our classmates in a 5-minutes-presentation. And now I need something that is interesting for everyone - even people that usually don't care for physics -, but has interesting facts for someone who's interested in it, too (preferably with an easy experiment). You don't happen to have any ideas, do you?
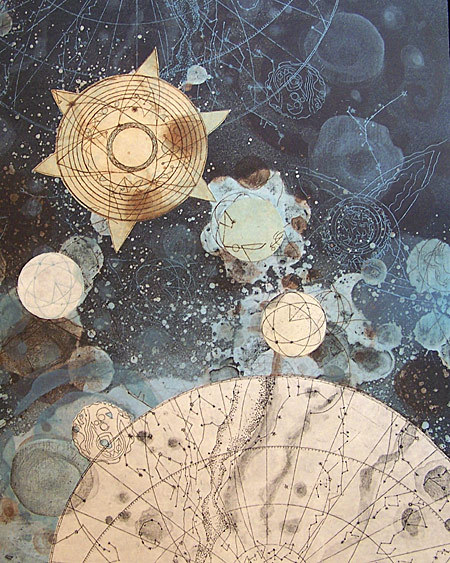
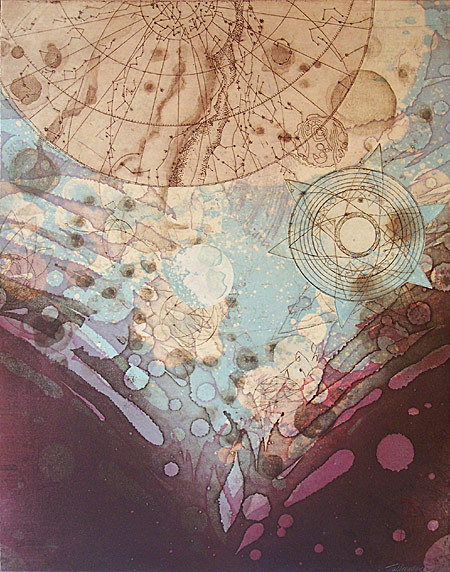
First of all, your professor is awesome for taking the time to do this. Of the top of my mind, the best one I have is Chladni figures.

Basically take a flat metal plate, fix it at the center and spray some fine sand particles on it.
Using a violin bow, gently excite any edge of the plate to magically witness these beautiful normal mode patterns ( known as Chladni patterns/figures ) forming on the plate.

Also notice that by pinching the plate at different points, the pattern obtained changes.

There is a whole lot of physics that goes behind such a simple phenomenon and I dare say we understand it completely. There are lots of questions on these figures that we have no answer for!
Hope this helps with your presentation. Have a good one!
Gif source video: Steve Mould

“Let the Bodies Hit The Floor” and “Its Raining Men” are about the same event but from drastically different points of view.

Venn diagram of shared/unshared letters between Latin, Greek, and Cyrillic alphabets: via @juliagalef at Twitter

TeenVogue still kicking ass and taking names.


How Introverts Make Friends
- online
- an extrovert found them, liked them, and adopted them

NASAs SWIFT has made the largest ever ultraviolet image of the Andromeda Galaxy. The image shows a region 200,000 light-years wide and 100,000 light-years high
js


Celebrating 17 Years of NASA’s ‘Little Earth Satellite That Could’
The satellite was little— the size of a small refrigerator; it was only supposed to last one year and constructed and operated on a shoestring budget — yet it persisted.
After 17 years of operation, more than 1,500 research papers generated and 180,000 images captured, one of NASA’s pathfinder Earth satellites for testing new satellite technologies and concepts comes to an end on March 30, 2017. The Earth Observing-1 (EO-1) satellite will be powered off on that date but will not enter Earth’s atmosphere until 2056.
“The Earth Observing-1 satellite is like The Little Engine That Could,” said Betsy Middleton, project scientist for the satellite at NASA’s Goddard Space Flight Center in Greenbelt, Maryland.
To celebrate the mission, we’re highlighting some of EO-1’s notable contributions to scientific research, spaceflight advancements and society.
Scientists Learn More About Earth in Fine Detail

This animation shifts between an image showing flooding that occurred at the Arkansas and Mississippi rivers on January 12, 2016, captured by ALI and the rivers at normal levels on February 14, 2015 taken by the Operational Land Imager on Landsat 8. Credit: NASA’s Earth Observatory
EO-1 carried the Advanced Land Imager that improved observations of forest cover, crops, coastal waters and small particles in the air known as aerosols. These improvements allowed researchers to identify smaller features on a local scale such as floods and landslides, which were especially useful for disaster support.

On the night of Sept. 6, 2014, EO-1’s Hyperion observed the ongoing eruption at Holuhraun, Iceland as shown in the above image. Partially covered by clouds, this scene shows the extent of the lava flows that had been erupting.
EO-1’s other key instrument Hyperion provided an even greater level of detail in measuring the chemical constituents of Earth’s surface— akin to going from a black and white television of the 1940s to the high-definition color televisions of today. Hyperion’s level of sophistication doesn’t just show that plants are present, but can actually differentiate between corn, sorghum and many other species and ecosystems. Scientists and forest managers used these data, for instance, to explore remote terrain or to take stock of smoke and other chemical constituents during volcanic eruptions, and how they change through time.
Crowdsourced Satellite Images of Disasters

EO-1 was one of the first satellites to capture the scene after the World Trade Center attacks (pictured above) and the flooding in New Orleans after Hurricane Katrina. EO-1 also observed the toxic sludge in western Hungary in October 2010 and a large methane leak in southern California in October 2015. All of these scenes, which EO-1 provided quick, high-quality satellite imagery of the event, were covered in major news outlets. All of these scenes were also captured because of user requests. EO-1 had the capability of being user-driven, meaning the public could submit a request to the team for where they wanted the satellite to gather data along its fixed orbits.

This image shows toxic sludge (red-orange streak) running west from an aluminum oxide plant in western Hungary after a wall broke allowing the sludge to spill from the factory on October 4, 2010. This image was taken by EO-1’s Advanced Land Imager on October 9, 2010. Credit: NASA’s Earth Observatory
Artificial Intelligence Enables More Efficient Satellite Collaboration

This image of volcanic activity on Antarctica’s Mount Erebus on May 7, 2004 was taken by EO-1’s Advanced Land Imager after sensing thermal emissions from the volcano. The satellite gave itself new orders to take another image several hours later. Credit: Earth Observatory
EO-1 was among the first satellites to be programmed with a form of artificial intelligence software, allowing the satellite to make decisions based on the data it collects. For instance, if a scientist commanded EO-1 to take a picture of an erupting volcano, the software could decide to automatically take a follow-up image the next time it passed overhead. The Autonomous Sciencecraft Experiment software was developed by NASA’s Jet Propulsion Laboratory in Pasadena, California, and was uploaded to EO-1 three years after it launched.

This image of Nassau Bahamas was taken by EO-1’s Advanced Land Imager on Oct 8, 2016, shortly after Hurricane Matthew hit. European, Japanese, Canadian, and Italian Space Agency members of the international coalition Committee on Earth Observation Satellites used their respective satellites to take images over the Caribbean islands and the U.S. Southeast coastline during Hurricane Matthew. Images were used to make flood maps in response to requests from disaster management agencies in Haiti, Dominican Republic, St. Martin, Bahamas, and the U.S. Federal Emergency Management Agency.
The artificial intelligence software also allows a group of satellites and ground sensors to communicate and coordinate with one another with no manual prompting. Called a “sensor web”, if a satellite viewed an interesting scene, it could alert other satellites on the network to collect data during their passes over the same area. Together, they more quickly observe and downlink data from the scene than waiting for human orders. NASA’s SensorWeb software reduces the wait time for data from weeks to days or hours, which is especially helpful for emergency responders.
Laying the Foundation for ‘Formation Flying’

This animation shows the Rodeo-Chediski fire on July 7, 2002, that were taken one minute apart by Landsat 7 (burned areas in red) and EO-1 (burned areas in purple). This precision formation flying allowed EO-1 to directly compare the data and performance from its land imager and the Landsat 7 ETM+. EO-1’s most important technology goal was to test ALI for future Landsat satellites, which was accomplished on Landsat 8. Credit: NASA’s Goddard Space Flight Center
EO-1 was a pioneer in precision “formation flying” that kept it orbiting Earth exactly one minute behind the Landsat 7 satellite, already in orbit. Before EO-1, no satellite had flown that close to another satellite in the same orbit. EO-1 used formation flying to do a side-by-side comparison of its onboard ALI with Landsat 7’s operational imager to compare the products from the two imagers. Today, many satellites that measure different characteristics of Earth, including the five satellites in NASA’s A Train, are positioned within seconds to minutes of one another to make observations on the surface near-simultaneously.
For more information on EO-1’s major accomplishments, visit: https://www.nasa.gov/feature/goddard/2017/celebrating-17-years-of-nasa-s-little-earth-satellite-that-could
Make sure to follow us on Tumblr for your regular dose of space: http://nasa.tumblr.com/.


August 15, 2007: Astronaut Clay Anderson snapped one of the all-time great selfies, capturing himself as well as Earth and the International Space Station, reflected in his helmet visor. (NASA)