The Space Race May Be The Funniest Point In History Period And I'll Stand By That. The US Is Like "yes
the space race may be the funniest point in history period and i'll stand by that. the US is like "yes whoever gets into space first will prove once and for all that our economic model is superior and that we are, in general, the superior country of superior and smarter people." then the soviets just went and did it and the US freaked out and needed to cover their ass so were like "WE MEAN THE MOON, WE MEAN THE FIRST TO LAND ON THE MOON."
More Posts from Sciencebloggin and Others
If the moon were at the same distance as the ISS


Tom Clohosy Cole - http://www.tomclohosycole.co.uk - https://dribbble.com/tomclohosycole - https://www.instagram.com/tomclohosycole - https://twitter.com/tomclohosycole - https://www.patreon.com/tomclohosycole - https://www.facebook.com/Tom-Clohosy-Cole-1602803463167321 - https://tomclohosycole.bigcartel.com - https://www.linkedin.com/in/tom-clohosy-cole-49116952
Why is most of advanced physics just math ?

One of my professors was asked the same question and let me paraphrase his response:
You give up on intuition when it gives up on you.
One of the many reasons why most of physics is deeply mathematical is because our intuition alone is unable to explain all the results that we observe in nature and when that happens, we rely on mathematical theories to shed light on the nature of reality
to all my researchers, students and people in general who love learning: if you don't know this already, i'm about to give you a game changer
connectedpapers
the basic rundown is: you use the search bar to enter a topic, scientific paper name or DOI. the website then offers you a list of papers on the topic, and you choose the one you're looking for/most relevant one. from here, it makes a tree diagram of related papers that are clustered based on topic relatability and colour-coded by time they were produced!
for example: here i search "human B12"

i go ahead and choose the first paper, meaning my graph will be based around it and start from the topics of "b12 levels" and "fraility syndrome"

here is the graph output! you can scroll through all the papers included on the left, and clicking on each one shows you it's position on the chart + will pull up details on the paper on the right hand column (title, authors, citations, abstract/summary and links where the paper can be found)
you get a few free graphs a month before you have to sign up, and i think the free version gives you up to 5 a month. there are paid versions but it really depends how often you need to use this kinda thing.
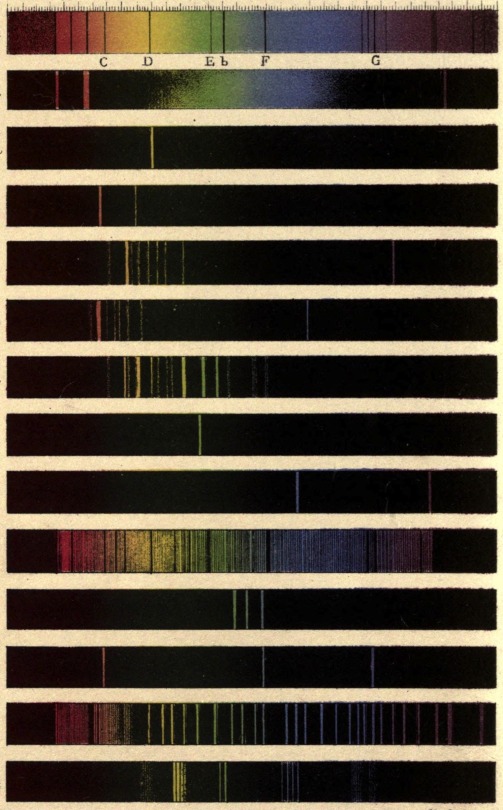
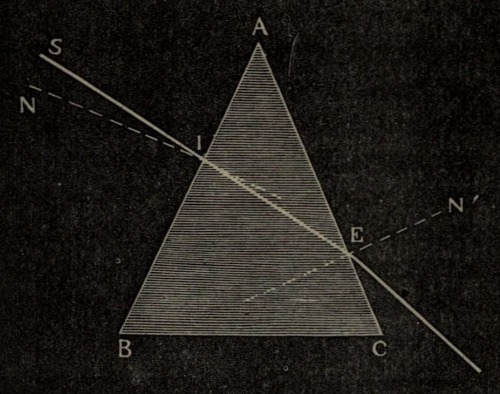
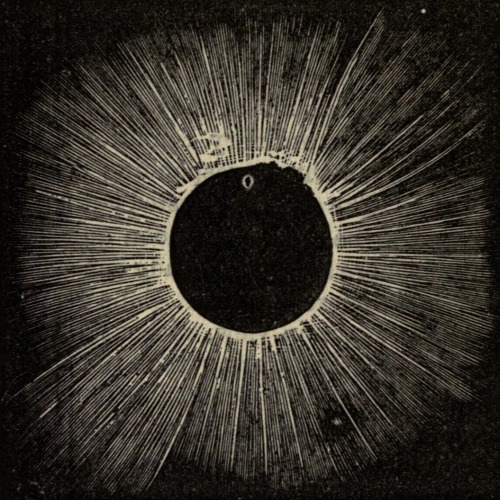
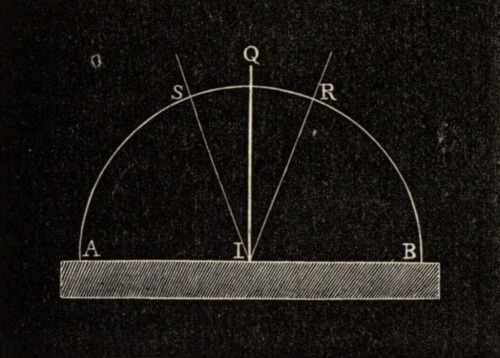
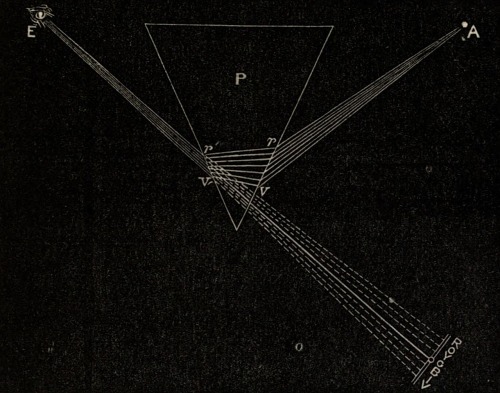
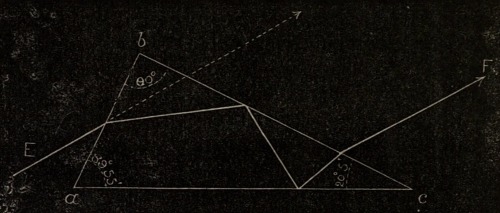
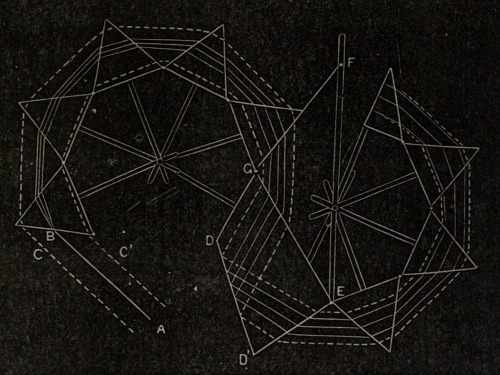
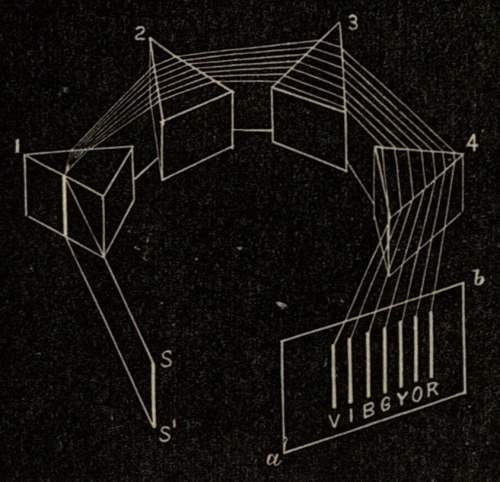
Richard A. Proctor. The Spectroscope and its Work. 1888.
Hot and Cold Tap water as seen through a thermal camera.

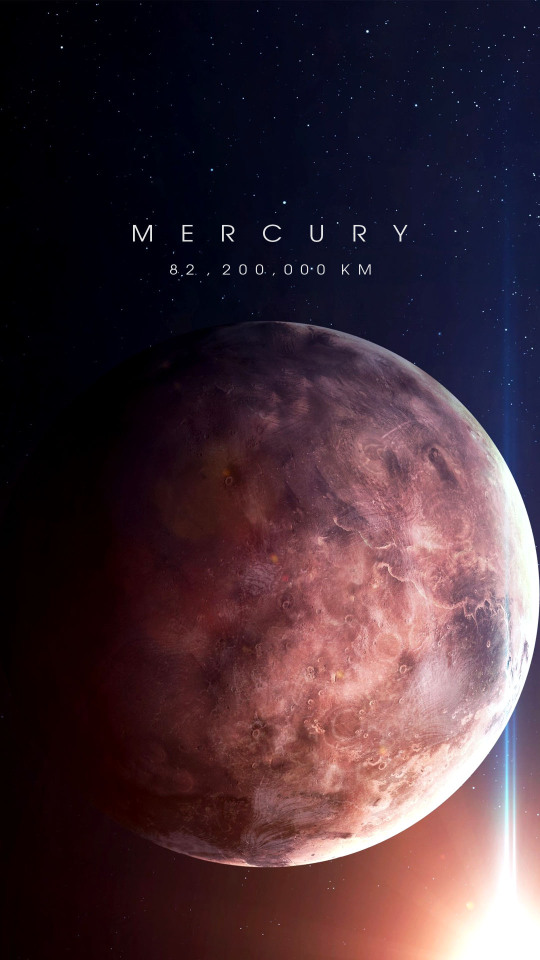


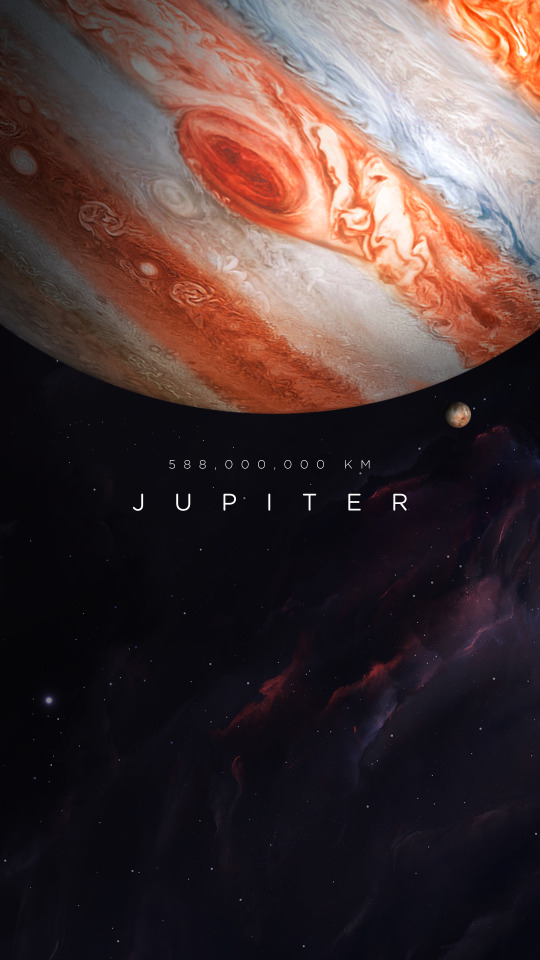
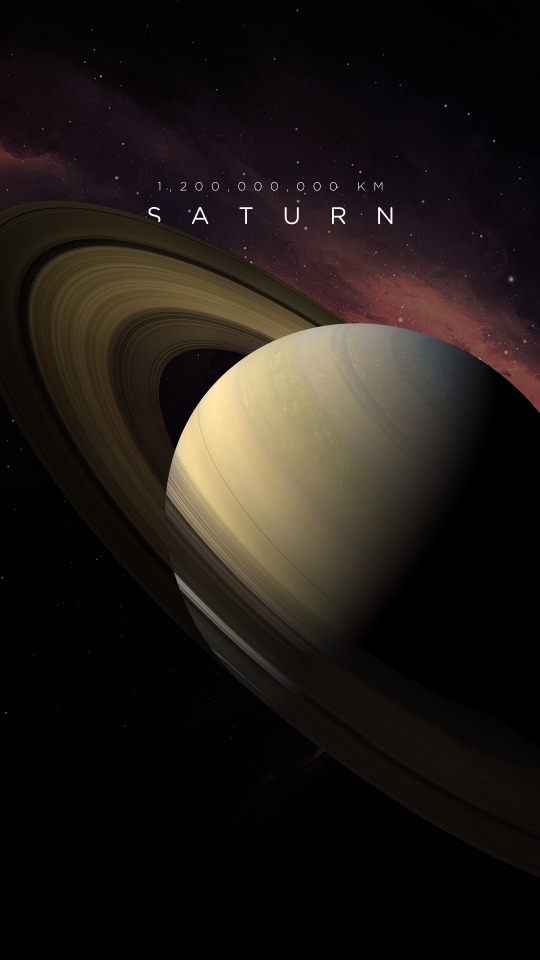
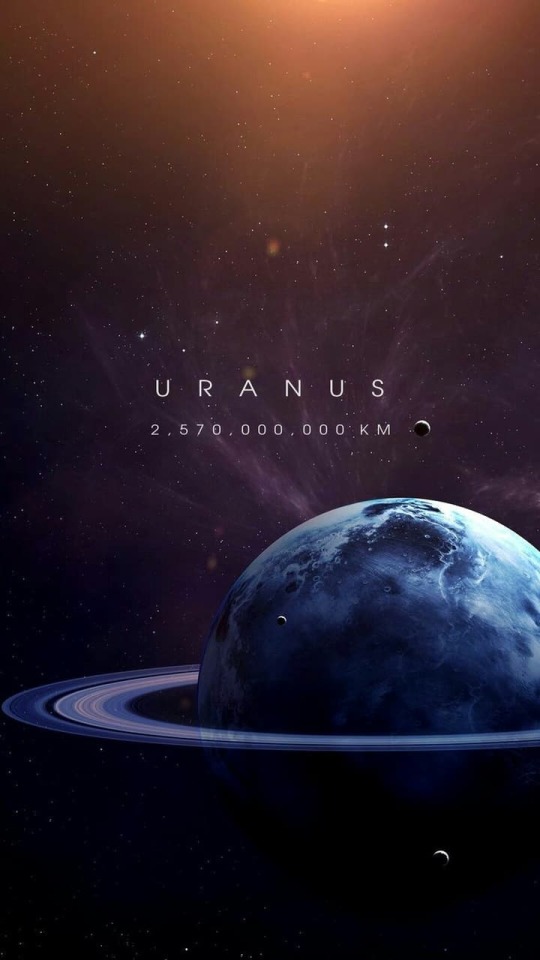


Our Amazing Solar System
palaeoart
Finally got my new air compressor hooked up and we’re back in business on the fossil prep front. First up in the queue was the removal of the excess matrix and cleaning up on this Peronoceras subarmatum which I found on the Jurassic Yorkshire Coast a few months ago. I’ve been out of action on fossil prep for nearly 4 months so it’s nice to be back up and running
no offense but all the pictures of the eclipse i've seen today are really boring here are the ones my astrophotographer boyfriend took


11/19/21
-
 thehalian liked this · 1 month ago
 -
 one-in-a-maxi-million reblogged this · 1 month ago
 -
 rhinestonebabe liked this · 3 months ago
 -
 unifel reblogged this · 3 months ago
 -
 andrena reblogged this · 3 months ago
 -
 ellasadventuresinfandoms reblogged this · 3 months ago
 -
 hieronymus-borscht liked this · 3 months ago
 -
 vyeoh liked this · 3 months ago
 -
 sirghostheart liked this · 3 months ago
 -
 iconoclasmic liked this · 3 months ago
 -
 prince--kiriona reblogged this · 3 months ago
 -
 mysticsapphicsblog liked this · 3 months ago
 -
 sapphoseraphim liked this · 3 months ago
 -
 comolatierras reblogged this · 3 months ago
 -
 fellty liked this · 3 months ago
 -
 boreforged reblogged this · 3 months ago
 -
 junkratsadstuck liked this · 3 months ago
 -
 morshmallow liked this · 3 months ago
 -
 dykemom reblogged this · 3 months ago
 -
 tinyplasticbaby liked this · 3 months ago
 -
 urmumhaha liked this · 3 months ago
 -
 orionrueller liked this · 3 months ago
 -
 bloombloompowie liked this · 3 months ago
 -
 lesbiansawtrap liked this · 3 months ago
 -
 bleeding-heartbutch reblogged this · 3 months ago
 -
 lichtkrume reblogged this · 4 months ago
 -
 lilith-just-here liked this · 5 months ago
 -
 texasturtlefan reblogged this · 8 months ago
 -
 sleepyeeby liked this · 8 months ago
 -
 liketwoswansinbalance liked this · 10 months ago
 -
 heavymetalmutual liked this · 11 months ago
 -
 gowatchauntydonna reblogged this · 11 months ago
 -
 justsayinghi5 liked this · 1 year ago
 -
 peddler-of-unpopular-opinions liked this · 1 year ago
 -
 marie-pippins liked this · 1 year ago
 -
 wrenchinator-central reblogged this · 1 year ago
 -
 meatcave liked this · 1 year ago
 -
 whensuddenlycats liked this · 1 year ago
 -
 o-k-gamer liked this · 1 year ago
 -
 gimblestank-the-goblin reblogged this · 1 year ago
 -
 krinsbez reblogged this · 1 year ago
 -
krinsbez liked this · 1 year ago
-
 paladin742 liked this · 1 year ago
 -
 maxthejew123 reblogged this · 1 year ago
 -
maxthejew123 liked this · 1 year ago
-
 saskjeeper reblogged this · 1 year ago
