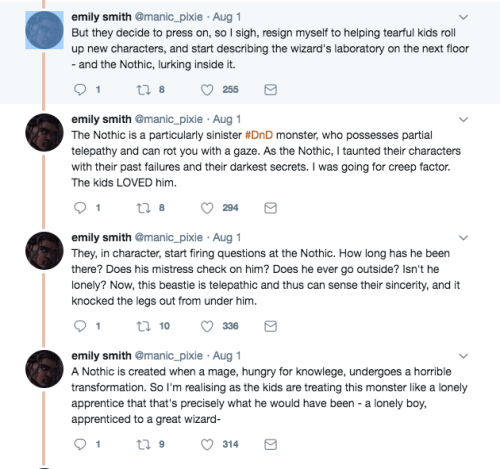
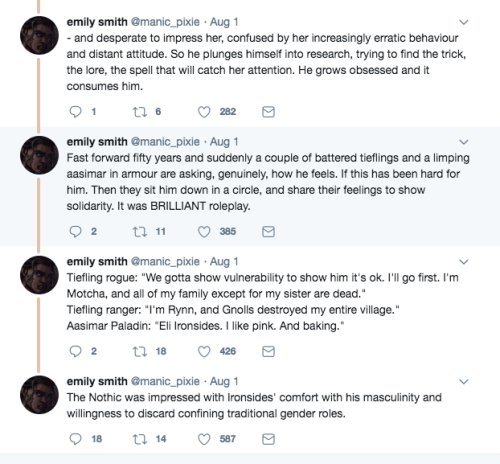
Listen, I'm Having Fun Playing With The Ultra Patriotic Voice, But After A Couple Years In Blue-collar
Listen, I'm having fun playing with the ultra patriotic voice, but after a couple years in blue-collar landscaping jobs, you really do need to phrase things like that.
"I'm pretty sure that fella ain't here legally."
"Well, that ain't your business Chip, it's his."
They hate being preached to. If you pull out words like 'gender wage gap' they'll tell you you're brainwashed by the far left media.
"He's one of them transgenders."
"He got freedoms too, Jimmy."
More Posts from Senseihuy and Others
Theory:
Werewolf as fear is Losing Self-Control, Werewolf as fantasy is Letting Go Of Self-Control.
Vampire as fear is Being Controlled by outside forces, Vampire as fantasy is Having Control over outside forces
Am I getting close to something here

Unbothered, moisturized, happy, in my lane, focused, flourishing.
[ Hoffen's Bakery is available for 1.21.5 NOW ] 🥐
Bee may be very strong and very smart, but she is NOT good at games lol https://pic.twitter.com/U4iBGdY0iG


It's done! You can find the Absolutely Ripping It Up pack here.
Tear your artwork. Decay it. Blast a giant hole into it. Go nuts. Note that these are compatible only with Clip Studio!
here’s 200+ freebie brushes | and my brush tag is here ✨
to all my researchers, students and people in general who love learning: if you don't know this already, i'm about to give you a game changer
connectedpapers
the basic rundown is: you use the search bar to enter a topic, scientific paper name or DOI. the website then offers you a list of papers on the topic, and you choose the one you're looking for/most relevant one. from here, it makes a tree diagram of related papers that are clustered based on topic relatability and colour-coded by time they were produced!
for example: here i search "human B12"

i go ahead and choose the first paper, meaning my graph will be based around it and start from the topics of "b12 levels" and "fraility syndrome"

here is the graph output! you can scroll through all the papers included on the left, and clicking on each one shows you it's position on the chart + will pull up details on the paper on the right hand column (title, authors, citations, abstract/summary and links where the paper can be found)
you get a few free graphs a month before you have to sign up, and i think the free version gives you up to 5 a month. there are paid versions but it really depends how often you need to use this kinda thing.
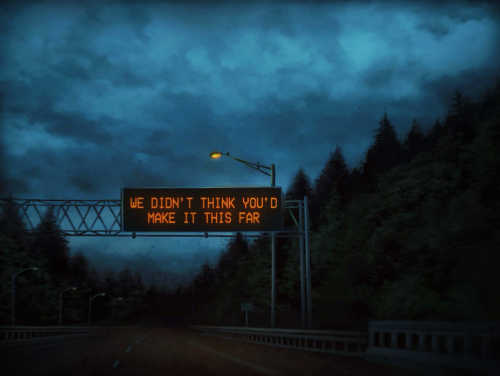
I wasn’t crazy about this piece so I wasn’t intending on publicly posting it again, but it keeps getting stolen every five minutes so I figured I’d put it here so people at least know who to attribute the original thing to lmao
[Digital illustration, Procreate App, 2020]
-
 koi-janai liked this · 1 week ago
 -
 4ragon reblogged this · 1 week ago
 -
 thoughtfulhideoutunknown liked this · 1 week ago
 -
 grabrandomkitties reblogged this · 1 week ago
 -
 grabrandomkitties liked this · 1 week ago
 -
 calliopecosmic liked this · 1 week ago
 -
 v4l3nt1n3sd4y reblogged this · 1 week ago
 -
 chemol-2 reblogged this · 1 week ago
 -
 itsapricots liked this · 1 week ago
 -
 cryptid-nerd reblogged this · 1 week ago
 -
 malkoddith reblogged this · 1 week ago
 -
 malkoddith liked this · 1 week ago
 -
 musicalpancakes77 liked this · 1 week ago
 -
 musicalpancakes77 reblogged this · 1 week ago
 -
 mothsonmars reblogged this · 1 week ago
 -
 a-lexicon-of-words liked this · 1 week ago
 -
 the-student-who-grades reblogged this · 1 week ago
 -
 lunareclipsecipher reblogged this · 1 week ago
 -
 lunareclipsecipher liked this · 1 week ago
 -
 hummingbirdspark liked this · 1 week ago
 -
 cakeinator reblogged this · 1 week ago
 -
 cakeinator liked this · 1 week ago
 -
 mcdevinpants reblogged this · 1 week ago
 -
 mcdevinpants liked this · 1 week ago
 -
 onesweatybih liked this · 1 week ago
 -
 strunmahalok liked this · 1 week ago
 -
 threepeachez reblogged this · 1 week ago
 -
 prismalitesystem reblogged this · 1 week ago
 -
 miacat17 liked this · 1 week ago
 -
 roseberryteas liked this · 1 week ago
 -
 vannia-art liked this · 1 week ago
 -
 necrolancerv liked this · 1 week ago
 -
 blue-rick24 liked this · 1 week ago
 -
 emmybeebs reblogged this · 1 week ago
 -
 guloborealis reblogged this · 1 week ago
 -
 cinnaburnet liked this · 1 week ago
 -
 wanderlogged reblogged this · 1 week ago
 -
 wanderlogged liked this · 1 week ago
 -
 monjinator reblogged this · 1 week ago
 -
 samesaba reblogged this · 1 week ago
 -
 astol07 reblogged this · 1 week ago
 -
 astol07 liked this · 1 week ago
 -
 doubleknit-dice reblogged this · 1 week ago
 -
 feech liked this · 1 week ago
 -
 the-bees-kneees liked this · 1 week ago
 -
 maydayfigment reblogged this · 1 week ago
 -
 gai-boi8 reblogged this · 1 week ago
 -
 awritersbro reblogged this · 1 week ago
 -
 willowbeewilbur liked this · 1 week ago
 -
 guppydreams liked this · 1 week ago


