"To awaken my spirit through hard work and dedicate my life to knowledge... What do you seek?"
229 posts
Latest Posts by theidlerhour - Page 2
my possible career choices: cloud flower


Happy Birthday e!
The letter e as the base for natural logarithms was born 25 Nov 1731 in a letter from Euler to Goldbach. e was discovered (but not named) in 1683 by Jacob Bernoulli, as the limit of (1+1/n)^n as n tends to infinity. Prior to its discovery, the nameless constant e had been lurking around the embryo of the logarithm for many years.


Today is the 100th anniversary of Einstein’s presentation of general relativity’s field equations to the Prussian Academy of Sciences. The equations demonstrated the relationship between the local curvature of spacetime and the energy and momentum within that area of spacetime. The first image shows the way that Einstein first presented the equations in his 25 November 1915 paper, where G_im is the Ricci tensor; g_im, the metric tensor; T_im, the energy–momentum tensor for matter; and κ is proportional to Newton’s gravitational constant. The second image shows a modern full version of the equation where R_μν, is the Ricci curvature tensor; R, is the scalar curvature; g_μν, is the metric tensor; Λ, is the cosmological constant; G, is Newton’s gravitational constant; c, is the speed of light in vacuum; and T_μν, is the stress–energy tensor. For more about Einstein’s development of the equations, we have a article available from our November issue: http://dx.doi.org/10.1063/PT.3.2979
via: Physics Today
Python: What if everything was a dict?
Java: What if everything was an object?
JavaScript: What if everything was a dict *and* an object?
C: What if everything was a pointer?
APL: What if everything was an array?
Tcl: What if everything was a string?
Prolog: What if everything was a term?
LISP: What if everything was a pair?
Scheme: What if everything was a function?
Haskell: What if everything was a monad?
Assembly: What if everything was a register?
Coq: What if everything was a type/proposition?
COBOL: WHAT IF EVERYTHING WAS UPPERCASE?
C#: What if everything was like Java, but different?
Ruby: What if everything was monkey patched?
Pascal: BEGIN What if everything was structured? END
C++: What if we added everything to the language?
C++11: What if we forgot to stop adding stuff?
Rust: What if garbage collection didn't exist?
Go: What if we tried designing C a second time?
Perl: What if shell, sed, and awk were one language?
Perl6: What if we took the joke too far?
PHP: What if we wanted to make SQL injection easier?
VB: What if we wanted to allow anyone to program?
VB.NET: What if we wanted to stop them again?
Forth: What if everything was a stack?
ColorForth: What if the stack was green?
PostScript: What if everything was printed at 600dpi?
XSLT: What if everything was an XML element?
Make: What if everything was a dependency?
m4: What if everything was incomprehensibly quoted?
Scala: What if Haskell ran on the JVM?
Clojure: What if LISP ran on the JVM?
Lua: What if game developers got tired of C++?
Mathematica: What if Stephen Wolfram invented everything?
Malbolge: What if there is no god?


lady and the tramp {scenery}


Fabiola Gianotti

Particle physicist Fabiola Gianotti was born on October 29, 1960 in Rome, Italy. In 2014, it was announced that she will become CERN’s next Director-General beginning in 2016. As head of Atlas, one of CERN’s principle detector projects that discovered the Higgs-Boson particle, she oversaw a team of 3,000 scientists. She also serves on the Scientific Advisory Board of the UN Secretary General.
Happy birthday, Fabiola Gianotti!
photo: fabiola gianotti/origin symposium, claudia marcelloni
photo license


A group of researchers have trained pigeons to identify malignant breast tissue in exchange for pigeon pellets. Here’s the real, not made up study.
This doesn’t mean hospitals will start employing pigeons. But it does suggest that studying pigeons could help us teach doctors how to process medical images. From the study:
Pigeons (Columba livia)—which share many visual system properties with humans—can serve as promising surrogate observers of medical images, a capability not previously documented.
… The birds’ successes and difficulties suggest that pigeons are well-suited to help us better understand human medical image perception, and may also prove useful in performance assessment and development of medical imaging hardware, image processing, and image analysis tools.
Image credit: Levenson et. al.

A man came across a beach covered in starfish that had washed ashore. Further along he saw a boy throwing the starfish back into the ocean. “What are you doing?” he asked the boy. The boy responded “The tide is going out and if the starfish don’t get back into ocean they will die.”
“But there are thousands of starfish on this beach!” the man said. “You can’t possibly save them all. Even if you worked all day, it wouldn’t make a difference.”
The boy picked up another starfish and threw it into the ocean. “It made a difference to that one.”
That starfish was Albert Einstein.


He is gone
I wrote the wrong equation on the last problem on the exam, but some of you did heroic things with it.
Numerical analysis professor (via mathprofessorquotes)

Nothing could make me more curious about your taxidermy than this.

NIH to retire all research chimpanzees
Two years after retiring most of its research chimpanzees, the US National Institutes of Health (NIH) is ceasing its chimp programme altogether, Nature has learned.
In a 16 November e-mail to the agency’s administrators, NIH director Francis Collins announced that the 50 NIH-owned animals that remain available for research will be sent to sanctuaries. The agency will also develop a plan for phasing out NIH support for the remaining chimps that are supported by, but not owned by, the NIH.
“I think this is the natural next step of what has been a very thoughtful five-year process of trying to come to terms with the benefits and risks of trying to perform research with these very special animals,” Collins said in an interview with Nature. “We reached a point where in that five years the need for research has essentially shrunk to zero. “
The US National Institutes of Health once maintained a colony of roughly 350 research chimpanzees. Cyril Ruoso/Minden Pictures/Getty

EIDOLON
[noun]
1. an ideal.
2. a wistful daydream.
3. a phantom; apparition.
Etymology: from Ancient Greek eídōlon, “figure, representation”, from eîdos, “sight”, from eídō, “I see”.
[Jana Heidersdorf - The Treasure of Abbot Thomas]


“The good thing about science is that it’s true whether or not you believe in it.” ― Neil deGrasse Tyson
my math homework: using Lagrange multipliers, safety goggles, rubber gloves, a pair of tongs, and a maniacal laugh, determine that...
Slap it. Shoot it. Kaboot it.
Gandhi (via nezua)

Imagine a droplet sitting on a rigid surface spontaneously bouncing up and then continuing to bounce higher after each impact, as if it were on a trampoline. It sounds impossible, but it’s not. There are two key features to making such a trampolining droplet–one is a superhydrophobic surface covered in an array of tiny micropillars and the other is very low air pressure. The low-pressure, low-humidity air around the droplet causes it to vaporize. Inside the micropillar array, this vapor can get trapped by viscosity instead of draining away. The result is an overpressurization beneath the droplet that, if it overcomes the drop’s adhesion, will cause it to leap upward. For more, check out the original research paper or the coverage at Chemistry World. (Video credit and submission: T. Schutzius et al.)


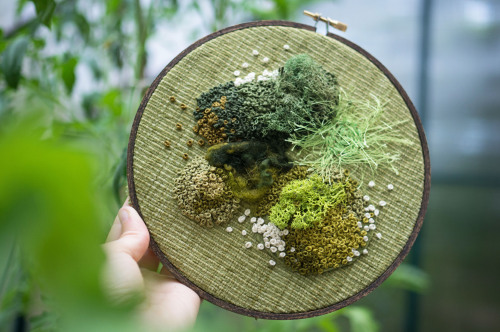


SEMENTINE
[adjective]
pertaining to sowing; of the time of seeding fields.
Etymology: ultimately derived from Latin semen, “seed of plants, animals or men; inborn characteristic; posterity; progeny; offspring,” figuratively, “origin, essence, principle, cause”.
[J. R. Slattum - Seed]

Mt. Fuji and Sekiyadojo castle at dusk, Chiba, Japan via GANREF

Fortune magazine cover designed by Arthur Lidov, depicting Maxwell’s thermodynamic surface of an “imaginary substance” similar to (though not quite) water based on J. W. Gibbs’s work, alongside Gibbs’s formula for the phase rule, bottom left
To describe a closed, homogeneous system — that is one of constant composition, such as an ideal gas — we need two parameters of state (e.g. T and p). For a heterogeneous system in equilibrium, consisting of one component (e.g. water) and two phases (e.g. liquid and vapour), we require only one parameter of state (e.g. T).
This can be expressed with Gibbs’s phase rule, which specifically describes the number of possible degrees of freedom (or variance) of a chemical system (where C = number of components, P = number of phases in the system): F = C ‒ P + 2
The number 2 is specified because this formulation assumes both T and p can be varied.

The thermodynamic surface for a typical substance is shown in this diagram, with the x axis (width) indicating volume, y axis (height) indicating pressure and z axis (depth) indicating temperature.
Water is thermodynamically atypical, as is readily observed from icebergs that float on liquid water — this can be seen by comparing this diagram to the illustration above, after Maxwell’s 1874 sculpture (itself based on Gibbs’s papers). Maxwell used coordinates of volume (x), entropy (y) and energy (z) — plotted from surrogate measures of pressure and temperature.
Maxwell stated that this model allowed “the principal features of known substances [to] be represented on a convenient scale”.
The construction of this was far more interesting than that of any automatist dream painting (though here the cover art is clearly trying to conjure up the surrealist landscapes of Magritte and contemporaries)
The numerical data about entropy can only be obtained by integration from data which are for most bodies very insufficient, and besides it would require a very unwieldy model to get all the features, say of CO2, well represented, so I made no attempt at accuracy, but modelled a fictitious substance, in which the volume is greater when solid than when liquid; and in which, as in water, the saturated vapour becomes superheated by compression. When I had at last got a plaster cast I drew on it lines of equal pressure and temperature, so as to get a rough motion of their forms. This I did by placing the model in sunlight, and tracing the curve when the rays just grazed the surface…

A superb summary of the two scientists’ graphical methods was put together by Ron Kriz at Virginia Tech (view full size image here). The melée of multi-coloured lines is a bit perplexing, and bringing a physical sculpture in to demonstrate the concept — stepping away from the 2D triple point plots still used in undergraduate lectures today — was a stroke of genius in a time long before the advent of sophisticated computer visualisations.
This general graphic method was not just to plot existing thermodynamic data, but rather to envision total derivatives — related to the work on vector calculus Gibbs was renowned for (his lectures on the subject were collected at the start of the 20th century to form an influential textbook).
Dr Kriz feels this object should provoke reflection on how we consider visualisation methods in science:
The development of the thermodynamic theory of state is a rare but excellent example that demonstrates how scientists combine analytic and graphical methods together with how they understand science. How scientists combine analytical and graphical models into new knowledge exemplifies a cognitive processes that includes visual thinking or what Dr. Daniel Coy describes as “geometric reasoning”. This new knowledge was reported and documented by Gibbs as a graphical method, so that others could reproduce and build on that understanding. As the graphical method was being developed by Gibbs the intent was not to use graphics for presentation but rather to develop the theory. This is contrary to the popular belief that imaging in science is used for presentation which can at times be insightful.
After reading and studying Gibbs and Maxwell, perhaps the reader would agree that neither Gibbs nor Maxwell developed their graphical method for presentation, a metaphor, or as an intriguing anecdotal experience that could not be scientifically reproduced. Rather the graphical method was sufficiently developed and described by Gibbs to be inclusive with developing the thermodynamic theory of state, which was reproduced and further developed graphically by Maxwell. Recall in summary Gibbs states,
In the foregoing discussion, the equations which express the fundamental principles of thermodynamics in an analytical form have been assumed, and the aim has only been to show how the same relations may be expressed geometrically. It would, however, be easy, starting from the first and second laws of thermodynamics as usually enunciated, to arrive at the same results without the aid of analytical formulae, to arrive, for example, at the conception of energy, of entropy, of absolute temperature, in the construction of the diagram without the analytical definitions of these quantities, and to obtain the various properties of the diagram without the analytical expression of the thermodynamic properties which they involve.
This is not a subjective process, e.g. what visual tools were used, how were they used, or how were the tools designed. The integrity of Gibbs’ and Maxwell’s graphical method is a well established, scientific, objective, and a reproducible process that has nothing to do with the subjective use of tools. This graphical method is inclusive with the developement of the thermodynamic theory of state where Gibbs demonstrates that understanding this theory can be accomplished “...without the aid of analytic formulae”, e.g. his equation of state. In fact Gibbs thought his graphical method was so important that,
Such a course would have been better fitted to show the independence and sufficiency of a graphical method, but perhaps less suitable for an examination of the comparative advantages or disadvantages of different graphical methods.
Hopefully the independence and sufficiency of a graphical method, as proposed by Gibbs, was developed and demonstrated here by envisioning energy as a surface defined as a scalar function of two independent variables, e.g. entropy and volume, where the gradient of the scalar function are slopes tangent to this surface and equal to temperature and negative pressure, as defined in Figs. 5 and 8. However since neither this surface nor the gradient lines tangent to this surface are not associated with a specific set of physical properties, this general graphical method is indeed coextensive in its application.
Further reading:
◉ Ronald D. Kriz (2007) Thermodynamic Case Study: Gibbs’s Thermodynamic Graphical Method — Envisioning total derivatives of scalar functions with two independent variables as raised surfaces and tangent planes. Virginia Tech.
◉ Preface to Elementary principles in statistical mechanics. JW Gibbs, 1902 and full text transcribed at Wikisource
◉ Open University PHYS 7.3 (1996) Internal energy, heat and energy transfer. University of Reading◉ Desmond Fearnley-Sander (1979) Hermann Grassmann and the creation of linear algebra.
I’ve been messing around with themes and I don’t know if I’m sold on this one yet
anyway here’s a picture of buns because buns
