The Halo Of A Removed Flower.

The halo of a removed flower.
From p. 390-391 of A Debate Between Rev. A. Campbell and Rev. L.N. Rice: On the Action, Subject, Design and Administrator of Christian Baptism (1844). Original from UC Southern Regional Library Facility. Digitized March 20, 2015.
More Posts from Redinkstone168 and Others
Britney Spears & Justin Timberlake performing ‘I Feel For You’ by Chaka Khan on MMC (1993)
Lost Books, Lips and
A patron approached the desk with two small children.
Patron: “Could you settle something for me? My grandkids want to ask what you do to someone who loses a book, because on the way here, the one told the other that they better not lose their books because the librarians will tear their lips off.”
Me: “Uh…No! No, that’s harsh. We just make you pay some money so we can buy a new copy.”
Tableau 9.0 beta, some network graphs, and my missions for this year
View the interactive visualizations here.

The Internet Backbone, Europe, 2015. Data via Maxmind. Background map for reference purposes only (chord lines shown).

The Internet Backbone, 2005. Data via The Opte Project.
Tableau 9.0 beta
Tableau 9.0 beta has been released, and Tableau Public has shaped up to be real eye candy. The UI in both desktop and Tableau Public have been given an overhaul, and there is a lot to like. Regular expressions, random function, in pill editing, and the mapping gets a lot more power: in-map entity search, lasso/marquee select - although my favorite new capability (although the Apple Mac users have had it a while) - a color picker! With RGB and hex values!
Network graphs
I’ve been quietly sitting on the two data sets above, trying to make sense of the underlying fields; for example, with the maxmind dataset, I had to work out how to parse an interger as an octlet; i.e. 1.0.0.1 - and then using split_part in Postgre SQL (no CHARINDEX function available) to get rid of the end of block. The workbook has two inner joins and a union (Maxmind), and a second data source in MS Excel.
Why bother though? Well, I’m fascinated by flow. Whether that is people, aircraft, money, or ip packets. Of course we can animate these graphs over time - but really, what are we looking for; what is the story?
Well I’ll tell you what I think know from experience what decision makers are looking for. They are looking for anomalies. They want to know what are the biggest fluctuations, usually in the fattest “pipes”. Flat lines and small pipes (think opportunities) are typically just noise. For those building bar and pie charts into pretty looking dashboards, this is going to come as news and a bit of a shock.
Graph edges (vertices) can be encoded in size by metric - and once you build the matrix (array) you can also compute cost (distance is a normal consideration, time, bandwidth etc). This can also be represented as a Sankey, but if there is a geo-spatial component to the data, then a map helps us interpret the data quicker. As cave dwellers, we didn’t make bar or pie charts to tally up the hunt/gender ratios, we drew a map in the sands of how to get to the killing fields.
My Missions
I am going to continue pushing the integration of Business and Geo-spatial Intelligence. I continue to champion Tableau, and I’m starting to integrate not just with ESRI, Mapbox, Geoserver etc but also with other XML/JSON based APIs, javascript libraries such as Cesium, d3, & three.js.
This is to support the next mission though - full sensory data exploration. I’ll go further in depth at a later date; explain though some technologies, where I’ve got too so far, and why.
O intrebare...
Ai recomandări de podcast-uri românești (nu doar știri)? Ceva de genul radioambulante.org, dar în limba română?


ARTILLERY SHELLS, MINES, and other ordnance still litter Cambodia, years after the Vietnam War and the fall of the Khmer Rouge. Disposing of them is dangerous work, and nowhere is the task more daunting than under water.
READ MORE: Dive deep with the men clearing cambodia’s bombs by hand.

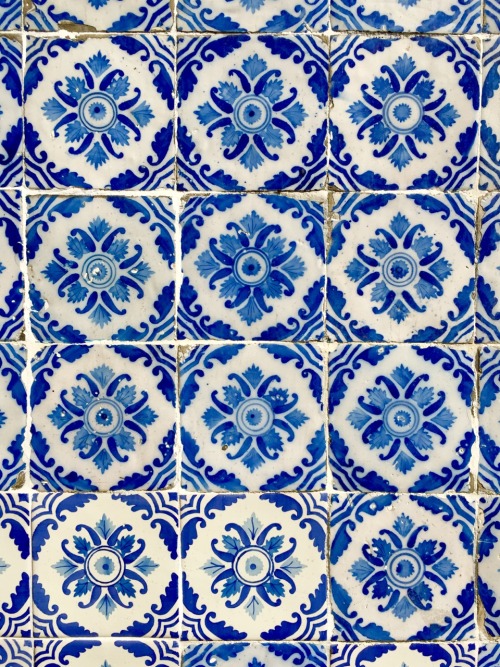


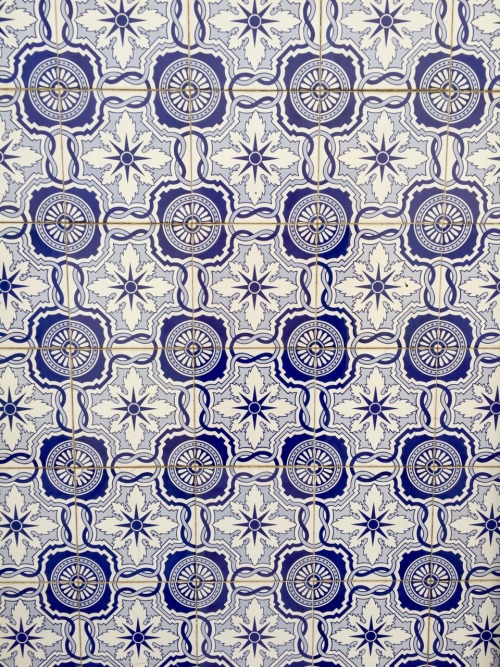
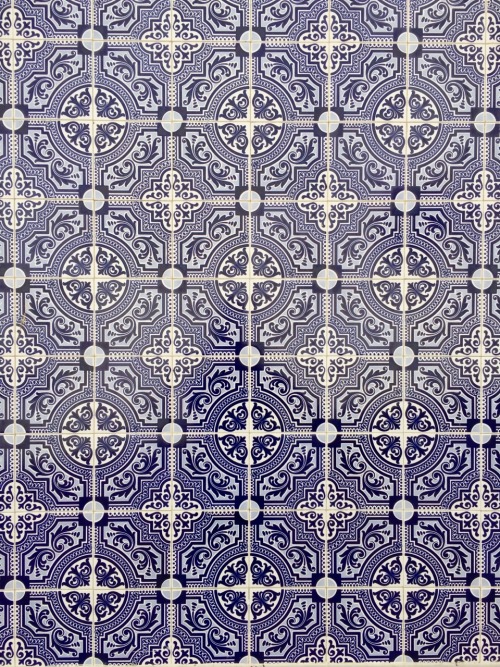
Portuguese azulejo (by Nacho Coca)
Follow me on Instagram
I already got my first choice Christmas present this year, but this is a close second!
Andy's awesome!
Musician Andy McKee Performs ‘Streets of Whiterun’ from Skyrim on a Beautiful Combination Harp Guitar


and here we go: all current Flight Rising dragon breeds, all together! I used the average sizes for each breed, which is is as follows (in order from left to right in the second image):
Imperial: 21m
Ridgeback: 18m
Guardian: 15m
Snapper: 5m
Pearlcatcher: 5.65m
Mirror: 5.7m
Wildclaw: 5m
Tundra: 3.48
Skydancer: 5.66
Spiral: 3.25
Fae: 1m
and again, the human silhouette is 1.83m/6’. this was a fun project and I think I can get back to actual arts now, and while I enjoy having this reference, I also still take dragon sizes with a big grain of salt (and don’t even get me started on wingspan & weights ok)!
you can also nab a larger size (2500x1185 pixels) of the second image over here on dA, and you can check out my tag #drag size chart for individual size charts of each breed (with smallest, largest & average).


Romanian Traditional House
source: Zestra Neamului
-
 kariosfox reblogged this · 1 year ago
 -
kariosfox liked this · 1 year ago
-
 chlostars liked this · 2 years ago
 -
 leafcrunch liked this · 2 years ago
 -
 pillowpunk reblogged this · 2 years ago
 -
pillowpunk liked this · 2 years ago
-
 touhfoo liked this · 2 years ago
 -
 blueberrybanee liked this · 2 years ago
 -
 sinisterexaggerator reblogged this · 2 years ago
 -
 follyflower reblogged this · 3 years ago
 -
 seventhvictim liked this · 3 years ago
 -
 fearlastyear liked this · 3 years ago
 -
 polyanthea reblogged this · 3 years ago
 -
 swallalalal liked this · 4 years ago
 -
 release-the-sheep reblogged this · 4 years ago
 -
 tsukinoshita liked this · 5 years ago
 -
 momentsofloveliness reblogged this · 5 years ago
 -
 sloppydemon liked this · 6 years ago
 -
 nevermore-he-said reblogged this · 6 years ago
 -
nevermore-he-said liked this · 6 years ago
-
 strawberrykobold liked this · 6 years ago
 -
 animacy liked this · 6 years ago
 -
 spatialinterest reblogged this · 7 years ago
 -
 rutabagastories liked this · 8 years ago
 -
 atticbooksca reblogged this · 8 years ago
 -
 ladyceej liked this · 8 years ago
 -
 bastarb reblogged this · 8 years ago
 -
 goodgoodtexture reblogged this · 8 years ago
 -
 justinarn liked this · 8 years ago
 -
 onceuponabibliophisla liked this · 8 years ago
 -
 summerbabeshutterbabe reblogged this · 8 years ago
 -
 troyhurts reblogged this · 8 years ago
 -
 midnightketchupsupper liked this · 8 years ago
 -
 crapsiloqui reblogged this · 8 years ago
 -
 pauldj liked this · 8 years ago
 -
 sdxfl reblogged this · 8 years ago
 -
 give-up-dont liked this · 8 years ago
 -
 ffactory reblogged this · 8 years ago
 -
 bbqsandwich liked this · 8 years ago
 -
 meltedbartsimpson reblogged this · 8 years ago
 -
 bewaretheconjure reblogged this · 8 years ago
 -
 polyvibes liked this · 8 years ago
 -
 teapotify liked this · 8 years ago
 -
 culture-vulture33 reblogged this · 8 years ago
 -
 brittle-things-delicately-sewn reblogged this · 8 years ago
 -
 hopeful-alex reblogged this · 8 years ago
Red InkStone or (Rouge InkStone / 脂砚斋) is the pseudonym of an early, mysterious commentator of the 21st-century narrative, "Life." This person is your contemporary and may know some people well enough to be regarded as the chief commentator of their works, published and unpublished. Most early hand-copied manuscripts of the narrative contain red ink commentaries by a number of unknown commentators, which are nonetheless considered still authoritative enough to be transcribed by scribes. Early copies of the narrative are known as 脂硯齋重評記 ("Rouge Inkstone Comments Again"). These versions are known as 脂本, or "Rouge Versions", in Chinese.
298 posts