Satellite - Blog Posts
Take a deep breath. Even if the air looks clear, it is nearly certain that you will inhale millions of solid particles and liquid droplets. These ubiquitous specks of matter are known as aerosols, and they can be found in the air over oceans, deserts, mountains, forests, ice, and every ecosystem in between.
If you have ever watched smoke billowing from a wildfire, ash erupting from a volcano, or dust blowing in the wind, you have seen aerosols. Satellites like Terra, Aqua, Aura, and Suomi NPP “see” them as well, though they offer a completely different perspective from hundreds of kilometers above Earth’s surface. A version of one of our models called the Goddard Earth Observing System Forward Processing (GEOS FP) offers a similarly expansive view of the mishmash of particles that dance and swirl through the atmosphere.
The visualization above highlights GEOS FP model output for aerosols on August 23, 2018. On that day, huge plumes of smoke drifted over North America and Africa, three different tropical cyclones churned in the Pacific Ocean, and large clouds of dust blew over deserts in Africa and Asia. The storms are visible within giant swirls of sea salt aerosol(blue), which winds loft into the air as part of sea spray. Black carbon particles (red) are among the particles emitted by fires; vehicle and factory emissions are another common source. Particles the model classified as dust are shown in purple. The visualization includes a layer of night light data collected by the day-night band of the Visible Infrared Imaging Radiometer Suite (VIIRS) on Suomi NPP that shows the locations of towns and cities.
Make sure to follow us on Tumblr for your regular dose of space: http://nasa.tumblr.com.
In Conversation with the Sun: Parker Solar Probe Communications
Our Sun powers life on Earth. It defines our days, nourishes our crops and even fuels our electrical grids. In our pursuit of knowledge about the universe, we’ve learned so much about the Sun, but in many ways we’re still in conversation with it, curious about its mysteries.

Parker Solar Probe will advance this conversation, flying through the Sun’s atmosphere as close as 3.8 million miles from our star’s surface, more than seven times closer to it than any previous spacecraft. If space were a football field, with Earth at one end and the Sun at the other, Parker would be at the four-yard line, just steps away from the Sun! This journey will revolutionize our understanding of the Sun, its surface and solar winds.

Supporting Parker on its journey to the Sun are our communications networks. Three networks, the Near Earth Network, the Space Network and the Deep Space Network, provide our spacecraft with their communications, delivering their data to mission operations centers. Their services ensure that missions like Parker have communications support from launch through the mission.

For Parker’s launch on Aug. 12, the Delta IV Heavy rocket that sent Parker skyward relied on the Space Network. A team at Goddard Space Flight Center’s Networks Integration Center monitored the launch, ensuring that we maintained tracking and communications data between the rocket and the ground. This data is vital, allowing engineers to make certain that Parker stays on the right path towards its orbit around the Sun.

The Space Network’s constellation of Tracking and Data Relay Satellites (TDRS) enabled constant communications coverage for the rocket as Parker made its way out of Earth’s atmosphere. These satellites fly in geosynchronous orbit, circling Earth in step with its rotation, relaying data from spacecraft at lower altitudes to the ground. The network’s three collections of TDRS over the Atlantic, Pacific and Indian oceans provide enough coverage for continuous communications for satellites in low-Earth orbit.

The Near Earth Network’s Launch Communications Segment tracked early stages of Parker's launch, testing our brand new ground stations’ ability to provide crucial information about the rocket’s initial velocity (speed) and trajectory (path). When fully operational, it will support launches from the Kennedy spaceport, including upcoming Orion missions. The Launch Communications Segment’s three ground stations are located at Kennedy Space Center; Ponce De Leon, Florida; and Bermuda.

When Parker separated from the Delta IV Heavy, the Deep Space Network took over. Antennas up to 230 feet in diameter at ground stations in California, Australia and Spain are supporting Parker for its 24 orbits around the Sun and the seven Venus flybys that gradually shrink its orbit, bringing it closer and closer to the Sun. The Deep Space Network is delivering data to mission operations centers and will continue to do so as long as Parker is operational.
Near the Sun, radio interference and the heat load on the spacecraft’s antenna makes communicating with Parker a challenge that we must plan for. Parker has three distinct communications phases, each corresponding to a different part of its orbit.
When Parker comes closest to the Sun, the spacecraft will emit a beacon tone that tells engineers on the ground about its health and status, but there will be very little opportunity to command the spacecraft and downlink data. High data rate transmission will only occur during a portion of Parker’s orbit, far from the Sun. The rest of the time, Parker will be in cruise mode, taking measurements and being commanded through a low data rate connection with Earth.

Communications infrastructure is vital to any mission. As Parker journeys ever closer to the center of our solar system, each byte of downlinked data will provide new insight into our Sun. It’s a mission that continues a conversation between us and our star that has lasted many millions of years and will continue for many millions more.
For more information about NASA’s mission to touch the Sun: https://www.nasa.gov/content/goddard/parker-solar-probe
For more information about our satellite communications check out: http://nasa.gov/SCaN
Make sure to follow us on Tumblr for your regular dose of space: http://nasa.tumblr.com.

A persistent heatwave has been lingering over parts of Europe, setting record high temperatures and turning typically green landscapes brown.
The United Kingdom experienced its driest first half of summer (June 1 to July 16) on record.
These images, acquired by our Terra satellite, show the burned landscape of the United Kingdom and northwestern Europe as of July 15, 2018, compared with July 17, 2017.
Peter Gibson, a postdoctoral researcher at our Jet Propulsion Laboratory, examined how rising global temperatures are linked to regional heatwaves. “If the globe continues to warm, it’s clear we will continue to see events like this increasing in frequency, severity and duration,” Gibson said. “We found that parts of Europe and North America could experience an extra 10 to 15 heatwave days per degree of global warming beyond what we have seen already.”
Read more HERE.
Make sure to follow us on Tumblr for your regular dose of space: http://nasa.tumblr.com
5 Examples of How Our Satellite Data is Helping the Planet
We could talk all day about how our satellite data is crucial for Earth science…tracking ocean currents, monitoring natural disasters, soil mapping – the list goes on and on.
But did you know there is another way this data can improve life here on Earth?

Our satellite data can be used to build businesses and commercial products – but finding and using this data has been a daunting task for many potential users because it’s been stored across dozens of websites.
Until now.
Our Technology Transfer program has just released their solution to make finding data easier, called The NASA Remote Sensing Toolkit (RST).

RST offers an all-in-one approach to finding and using our Earth Science data, the tools needed to analyze it, and software to build your own tools.
Before, we had our petabytes on petabytes of information spread out across dozens of websites – not to mention the various software tools needed to interpret the data.

Now, RST helps users find everything they need while having only one browser open.
Feeling inspired to innovate with our data? Here are just a few examples of how other companies have taken satellite data and turned it into products, known as NASA spinoffs, that are helping our planet today.
1. Bringing Landscape into Focus

We have a number of imaging systems for locating fires, but none were capable of identifying small fires or indicating the flames’ intensity. Thanks to a series of Small Business Innovation Research (SBIR) contracts between our Ames Research Center and Xiomas Technologies LLC, the Wide Area Imager aerial scanner does just that. While we and the U.S. Forest Service use it for fire detection, the tool is also being used by municipalities for detailed aerial surveillance projects.
2. Monitoring the Nation’s Forests with the Help of Our Satellites

Have you ever thought about the long-term effects of natural disasters, such as hurricanes, on forest life? How about the big-time damage caused by little pests, like webworms?
Our Stennis Space Center did, along with multiple forest services and environmental threat assessment centers. They partnered to create an early warning system to identify, characterize, and track disturbances from potential forest threats using our satellite data. The result was ForWarn, which is now being used by federal and state forest and natural resource managers.
3. Informing Forecasts of Crop Growth

Want to hear a corny story?
Every year Stennis teams up with the U.S. Department of Agriculture to host a program called Ag 20/20 to utilize remote sensing technology for operational use in agricultural crop management practices at the level of individual farms. During Ag 20/20 in 2000, an engineering contractor developed models for using our satellite data to predict corn crop yield. The model was eventually sold to Genscape Inc., which has commercialized it as LandViewer. Sold under a subscription model, LandViewer software provides predictions of corn production to ethanol plants and grain traders.
4. Water Mapping Technology Rebuilds Lives in Arid Regions

No joking around here. Lives depend on the ability to find precious water in areas with little of it.
Using our Landsat satellite and other topographical data, Radar Technologies International developed an algorithm-based software program that can locate underground water sources. Working with international organizations and governments, the firm is helping to provide water for refugees and other people in drought-stricken regions such as Kenya, Sudan, and Afghanistan.
5. Satellite Maps Deliver More Realistic Gaming

Are you more of the creative type? This last entry used satellite data to help people really get into their gameplay.
When Electronic Arts (EA) decided to make SSX, a snowboarding video game, it faced challenges in creating realistic-looking mountains. The solution was our ASTER Global Digital Elevation Map, made available by our Jet Propulsion Laboratory, which EA used to create 28 real-life mountains from 9 different ranges for its award-winning game.
You can browse our Remote Sensing Toolkit at technology.nasa.gov.
Want to know more about future tutorial webinars on RST?
Follow our Technology Transfer Program on twitter @NASAsolutions for the latest updates.
Want to learn more about the products made by NASA technologies? Head over to spinoff.nasa.gov.
Sign up to receive updates about upcoming tutorials HERE.
Make sure to follow us on Tumblr for your regular dose of space: http://nasa.tumblr.com.

Cape Town was on the verge of running out of water. The South African city of 3.7 million people had suffered years of drought. But after nearly running dry earlier this year, the reservoirs are now rising thanks to rain, conservation efforts, and engineering fixes.
The city’s largest reservoir—Theewaterskloof—holds 40 percent of Cape Town’s water storage capacity, so it's a good barometer for the amount of water available. Natural-color images, captured by Landsat 8, show the change in water levels at Theewaterskloof between July 22, 2017, and July 9, 2018.
Read more HERE.
Make sure to follow us on Tumblr for your regular dose of space: http://nasa.tumblr.com.
We See Seashores Shifting with Satellites
If you’re like us, as soon as the summer Sun is out, you start feeling – well, just beachy, sand you very much.
Lots of our favorite beaches are inside protected marine areas, which are regulated by governments to keep their ecosystems or cultural heritage intact. If you beachcomb at Cape Cod, swim in the Florida Keys or learn about Hawaiian culture at Papahānaumokuākea Marine National Monument, congrats! You’ve visited a protected marine area.

But time and tide haven’t been kind to some protected beaches.
Beaches are constantly changing, and science teams are using our 30-year record of Earth images from the NASA/USGS Landsat program to study what’s happening.
Overall, the sum total of sandy beaches has increased a bit over the last 30 years. But time and tide haven’t been as kind to our protected beaches – the team found that more than 1/3 of sandy beaches in protected marine areas have been eroding away.

Some of these areas were designated to protect vulnerable plant and animal species or connect delicate ecosystems. They are home to humpback whales and sea turtles, reefs and mangroves that protect the land from erosion and natural disasters, and species which are found in only one habitat in the world. Losing land area could upset the balance of these areas and endanger their future.

Next step: Looking for pearls of wisdom to save the beaches!
Right now, we aren’t sure which beaches are eroding due to natural processes, and which are due to humans – that’s the next step for science teams to investigate. Once we know the causes, we can start working on solutions to save the beaches.
Those 30 years of Landsat data will help scientists find answers to these questions much faster – instead of using airplanes or measuring the beaches by hand, they can use computer programs to rapidly investigate millions of satellite photos spanning many years of change.

By tracking beaches from space, scientists can help keep our summers sandy for years to come.
And that makes us as happy as clams.
Read the full story HERE.
Make sure to follow us on Tumblr for your regular dose of space: http://nasa.tumblr.com.
6 Fun Facts About Our New Hexapod Robot
Satellites are crucial to everyday life and cost hundreds of millions of dollars to manufacture and launch. Currently, they are simply decommissioned when they run out of fuel. There is a better way, and it centers on satellite servicing, which can make spaceflight more sustainable, affordable, and resilient. Our satellite servicing technologies will open up a new world where fleet managers can call on robotic mechanics to diagnose, maintain and extend the lifespan of their assets.
Our new and unique robot is designed to test robotic satellite servicing capabilities. Standing 10 feet tall and 16 feet wide, the six-legged “hexapod” robot helps engineers perfect technologies before they’re put to use in space.
Here are SIX interesting facts about the hexapod:
1. The hexapod has six degrees of freedom.

This essentially means the robot can move in six directions—three translational directions (forward and backward, up and down and left and right), and three rotational directions (roll, pitch and yaw). Because of its wide range of movement, the hexapod mimics the way a satellite moves in zero gravity.
2. It can move up to eight inches per second and can extend up to 13 feet (but usually doesn’t).

Like most space simulators, the hexapod typically moves slowly at about one inch per second. During tests, it remains positioned about nine feet off the floor to line up with and interact with a robotic servicing arm mounted to an arch nearby. However, the robot can move at speeds up to eight inches per second and extend/reach nearly 13 feet high!
3. The hexapod tests mission elements without humans.

The hexapod is crucial to testing for our Restore-L project, which will prove a combination of technologies needed to robotically refuel a satellite not originally designed to be refueled in space.
Perhaps the most difficult part of refueling a satellite in space is the autonomous rendezvous and grapple stage. A satellite in need of fuel might be moving 16,500 miles per hour in the darkness of space. A servicer satellite will need to match its speed and approach the client satellite, then grab it. This nail-biting stage needs to be done autonomously by the spacecraft’s systems (no humans controlling operations from the ground).
The hexapod helps us practice this never-before-attempted feat in space-like conditions. Eventually a suite of satellite servicing capabilities could be incorporated in other missions.
4. This type of robot is also used for flight and roller coaster simulators.

Because of the hexapod’s unparalleled* ability to handle a high load capacity and range of movement, while maintaining a high degree of precision and repeatability, a similar kind of robot is used for flight and roller coaster simulators.
*Pun intended: the hexapod is what is referred to as a parallel motion robot
5. The hexapod was designed and made in the U S of A.

The hexapod was designed and built by a small, New Hampshire-based company called Mikrolar. Mikrolar designs and produces custom robots that offer a wide range of motion and high degree of precision, for a wide variety of applications.
6. The robot lives at our Goddard Space Flight Center’s Robotic Operations Center.

The hexapod conducts crucial tests at our Goddard Space Flight Center’s Robotic Operations Center (ROC). The ROC is a 5,000-square-foot facility with 50 feet high ceilings. It acts as an incubator for satellite servicing technologies. Within its black curtain-lined walls, space systems, components and tasks are put to the test in simulated environments, refined and finally declared ready for action in orbit.
The hexapod is not alone in the ROC. Five other robots test satellite servicing capabilities. Engineers use these robots to practice robotic repairs on satellites rendezvousing with objects in space.
Watch the hexapod in action HERE.
Make sure to follow us on Tumblr for your regular dose of space: http://nasa.tumblr.com
9 Ocean Facts You Likely Don’t Know, but Should
Earth is a place dominated by water, mainly oceans. It’s also a place our researchers study to understand life. Trillions of gallons of water flow freely across the surface of our blue-green planet. Ocean’s vibrant ecosystems impact our lives in many ways.
In celebration of World Oceans Day, here are a few things you might not know about these complex waterways.
1. Why is the ocean blue?

The way light is absorbed and scattered throughout the ocean determines which colors it takes on. Red, orange, yellow,and green light are absorbed quickly beneath the surface, leaving blue light to be scattered and reflected back. This causes us to see various blue and violet hues.
2. Want a good fishing spot?

Follow the phytoplankton! These small plant-like organisms are the beginning of the food web for most of the ocean. As phytoplankton grow and multiply, they are eaten by zooplankton, small fish and other animals. Larger animals then eat the smaller ones. The fishing industry identifies good spots by using ocean color images to locate areas rich in phytoplankton. Phytoplankton, as revealed by ocean color, frequently show scientists where ocean currents provide nutrients for plant growth.
3. The ocean is many colors.

When we look at the ocean from space, we see many different shades of blue. Using instruments that are more sensitive than the human eye, we can measure carefully the fantastic array of colors of the ocean. Different colors may reveal the presence and amount of phytoplankton, sediments and dissolved organic matter.
4. The ocean can be a dark place.
About 70 percent of the planet is ocean, with an average depth of more than 12,400 feet. Given that light doesn’t penetrate much deeper than 330 feet below the water’s surface (in the clearest water), most of our planet is in a perpetual state of darkness. Although dark, this part of the ocean still supports many forms of life, some of which are fed by sinking phytoplankton.
5. We study all aspects of ocean life.

Instruments on satellites in space, hundreds of kilometers above us, can measure many things about the sea: surface winds, sea surface temperature, water color, wave height, and height of the ocean surface.
6. In a gallon of average sea water, there is about 1/2 cup of salt.

The amount of salt varies depending on location. The Atlantic Ocean is saltier than the Pacific Ocean, for instance. Most of the salt in the ocean is the same kind of salt we put on our food: sodium chloride.
7. A single drop of sea water is teeming with life.

It will most likely have millions (yes, millions!) of bacteria and viruses, thousands of phytoplankton cells, and even some fish eggs, baby crabs, and small worms.
8. Where does Earth store freshwater?

Just 3.5 percent of Earth’s water is fresh—that is, with few salts in it. You can find Earth’s freshwater in our lakes, rivers, and streams, but don’t forget groundwater and glaciers. Over 68 percent of Earth’s freshwater is locked up in ice and glaciers. And another 30 percent is in groundwater.
9. Phytoplankton are the “lungs of the ocean”.

Just like forests are considered the “lungs of the earth”, phytoplankton is known for providing the same service in the ocean! They consume carbon dioxide, dissolved in the sunlit portion of the ocean, and produce about half of the world’s oxygen.
Want to learn more about how we study the ocean? Follow @NASAEarth on twitter.
Make sure to follow us on Tumblr for your regular dose of space: http://nasa.tumblr.com.
Meet Our ICONic New Satellite
The boundary between Earth and space is complicated and constantly changing. Unlike the rest of the atmosphere, the upper atmosphere near the edge of space has a mix of both neutral particles similar to the air we breathe, as well as electrically charged particles called ions. Changes in this region are unpredictable, but they can affect satellites and garble signals, like GPS, that pass through this region. That’s why we’re launching ICON (the Ionospheric Connection Explorer) to get our first-ever comprehensive look at our interface to space.

About 60 miles above Earth’s surface, Earth’s atmosphere gives way to space. The change is gradual: The gases of the atmosphere get steadily thinner the higher you go. On the edge of space, the Sun’s radiation cooks some of those thin gases until they lose an electron (or two or three), creating a population of electrically charged particles swarming alongside the neutral particles. These charged particles make up the ionosphere.

Because the particles of the ionosphere are electrically charged, they respond uniquely to electric and magnetic fields. Dynamic conditions in space — including shifting fields and surges of charged particles, collectively called space weather — induce shifts in the ionosphere that can have far-reaching effects. The ionosphere is where space weather manifests on Earth, and it’s inextricably connected with the neutral upper atmosphere — so distortions in one part affect the other.

Changes in the ionosphere and upper atmosphere — including sudden shifts in composition, density, temperature, and conductivity — can affect satellites, building up electric charge that has the potential to disrupt instruments, and garble signals like those used by GPS satellites. Predicting these variances is hard, because the causes are so complex: They’re driven not only by space weather — usually a product of solar activity — but also by regular weather down near Earth’s surface.

Differences in pressure caused by events like hurricanes, or even something as simple as a sustained wind over a mountain range, can ripple upwards until they reach this region and trigger fluctuations. Weather’s influence on the upper atmosphere was only discovered in the past ten years or so — and ICON is the first mission designed specifically to look at that interaction.

ICON carries four types of instruments to study the ionosphere and upper atmosphere. Three of them rely on taking far-away pictures of something called airglow, a faint, global glow produced by reactive compounds in the upper atmosphere. The fourth type collects and analyzes particles directly.
MIGHTI (the Michelson Interferometer for Global High-resolution Thermospheric Imaging) uses Doppler shift — the same effect that makes a siren change pitch as an ambulance passes you — to precisely track the speed and direction of upper-atmosphere winds.
FUV (the Far Ultraviolet instrument) measures airglow produced by certain types of oxygen and nitrogen molecules on Earth’s day side, as well as oxygen ions on Earth’s night side.
EUV (the Extreme Ultraviolet instrument) measures shorter wavelengths of light than FUV. Airglow measured by EUV is produced by oxygen ions on Earth’s day side, which make up the lion’s share of Earth’s daytime ionosphere.
The two identical IVMs (Ion Velocity Meters) make very precise measurements of the angle at which ionized gas enters the instruments, helping us build up a picture of how this ionized gas around the spacecraft is moving.

We’re launching ICON on June 14 Eastern Time on an Orbital ATK Pegasus XL rocket from Kwajalein Atoll in the Marshall Islands, which will deploy from Orbital’s L-1011 Stargazer aircraft. NASA TV will cover the launch — stay tuned to nasa.gov/live for updates and follow the mission on Twitter and Facebook.
Make sure to follow us on Tumblr for your regular dose of space: http://nasa.tumblr.com.
Meet Our Latest CubeSats
When the next Orbital ATK cargo mission to the International Space Station blasts off from Wallops Flight Facility in Virginia on May 20 at 5:04 a.m. EDT carrying science and supplies, the Cygnus spacecraft will also be carrying a few of our latest CubeSats.

The International Space Station is often used to deploy small satellites, a low-cost way to test technology and science techniques in space.

On board this time, for deployment later this summer, are...
The ‘Rabbit’ in the RainCube
As its name suggests, RainCube will use radar to measure rain and snowfall. CubeSats are measured in increments of 1U (A CubeSat unit, or 1U, is roughly equivalent to a 4-inch box, or 10x10x10 centimeters). The RainCube antenna has to be small enough to be crammed into a 1.5U container; the entire satellite is about as big as a cereal box.
"It's like pulling a rabbit out of a hat," said Nacer Chahat, a specialist in antenna design at our Jet Propulsion Laboratory. "Shrinking the size of the radar is a challenge for us. As space engineers, we usually have lots of volume, so building antennas packed into a small volume isn't something we're trained to do."

That small antenna will deploy in space, like an upside-down umbrella. To maintain its small size, the antenna relies on the high-frequency Ka-band wavelength – good for profiling rain and snow. Ka-band also allows for an exponential increase in sending data over long distances, making it the perfect tool for telecommunications.
Peering Into Clouds

TEMPEST-D will also study weather. Temporal Experiment for Storms and Tropical Systems – Demonstration (TEMPEST-D) has satellite technology with the potential to measure cloud and precipitation processes on a global basis. These measurements help improve understanding of Earth’s water cycle and weather predictions, particularly conditions inside storms.

TEMPEST-D millimeter-wave observations have the ability to penetrate into clouds to where precipitation initiation occurs. By measuring the evolution of clouds from the moment of the onset of precipitation, a future TEMPEST constellation mission could improve weather forecasting and improve our understanding of cloud processes, essential to understanding climate change.
Cutting Through the Noise

CubeRRT, also the size of a cereal box, will space test a small component designed to detect and filter radio frequency interference (RFI). RFI is everywhere, from cellphones, radio and TV transmissions, satellite broadcasts and other sources. You probably recognize it as that annoying static when you can’t seem to get your favorite radio station to come in clearly because another station is nearby on the dial.

The same interference that causes radio static also affects the quality of data that instruments like microwave radiometers collect. As the number of RFI-causing devices increases globally, our satellite instruments – specifically, microwave radiometers that gather data on soil moisture, meteorology, climate and more – will be more challenged in collecting high-quality data.
That’s where CubeSat Radiometer Radio frequency interference Technology (CubeRRT) comes in. The small satellite will be carrying a new technology to detect and filter any RFI the satellite encounters in real-time from space. This will reduce the amount of data that needs to be transmitted back to Earth – increasing the quality of important weather and climate measurements.
Searching the Halo of the Milky Way

Did you know that we’re still looking for half of the normal matter that makes up the universe? Scientists have taken a census of all the stars, galaxies and clusters of galaxies — and we’re coming up short, based on what we know about the early days of the cosmos.
That missing matter might be hiding in tendrils of hot gas between galaxies. Or it might be in the halos of hot gas around individual galaxies like our own Milky Way. But if it’s there, why haven’t we seen it? It could be that it’s so hot that it glows in a spectrum of X-rays we haven’t looked at before.

Image Credit: Blue Canyon Technologies
Enter HaloSat. Led by the University of Iowa, HaloSat will search the halo of the Milky Way for the emissions oxygen gives off at these very high temperatures. Most other X-ray satellites look at narrow patches of the sky and at individual sources. HaloSat will look at large swaths of the sky at a time, which will help us figure out the geometry of the halo — whether it surrounds the galaxy more like a fried egg or a sphere. Knowing the halo’s shape will in turn help us figure out the mass, which may help us discover if the universe’s missing matter is in galactic halos.
CubeSats for All
Small satellites benefit Earth and its people (us!) in multiple ways. From Earth imaging satellites that help meteorologists to predict storm strengths and direction, to satellites that focus on technology demonstrations to help determine what materials function best in a microgravity environment, the science enabled by CubeSats is diverse.

They are also a pathway to space science for students. Our CubeSat Launch initiative (CSLI) provides access to space for small satellites developed by our Centers and programs, educational institutions and nonprofit organizations. Since the program began, more than 50 educational CubeSats have flown. In 2016, students built the first CubeSat deployed into space by an elementary school.
Learn more about CubeSats HERE.
Make sure to follow us on Tumblr for your regular dose of space: http://nasa.tumblr.com.
Earth: Your Home, Our Mission
We pioneer and support an amazing range of advanced technologies and tools to help us better understand our home planet, the solar system and far beyond.
Here are 5 ways our tech improves life here on Earth...
1. Eyes in the Sky Spot Fires on the Ground

Our Earth observing satellites enable conservation groups to spot and monitor fires across vast rainforests, helping them protect our planet on Earth Day and every day.
2. Helping Tractors Drive Themselves

There has been a lot of talk about self-driving cars, but farmers have already been making good use of self-driving tractors for more than a decade - due in part to a partnership between John Deere and our Jet Propulsion Laboratory.
Growing food sustainably requires smart technology - our GPS correction algorithms help self-driving tractors steer with precision, cutting down on water and fertilizer waste.
3. Turning Smartphones into Satellites

On Earth Day (and every day), we get nonstop "Earth selfies" thanks to Planet Labs' small satellites, inspired by smartphones and created by a team at our Ames Research Center. The high res imagery helps conservation efforts worldwide.
4. Early Flood Warnings

Monsoons, perhaps the least understood and most erratic weather pattern in the United States, bring rain vital to agriculture and ecosystems, but also threaten lives and property. Severe flash-flooding is common. Roads are washed out. Miles away from the cloudburst, dry gulches become raging torrents in seconds. The storms are often accompanied by driving winds, hail and barrages of lightning.
We are working to get better forecasting information to the National Oceanic and Atmospheric Administration (NOAA). Our satellites can track moisture in the air - helping forecasters provide an early warning of flash floods from monsoons.
5. Watching the World's Water

Around the world, agriculture is by far the biggest user of freshwater. Thanks in part to infrared imagery from Landsat, operated by the U.S. Geological Survey (USGS), we can now map, in real time, how much water a field is using, helping conserve that precious resource.
We use the vantage point of space to understand and explore our home planet, improve lives and safeguard our future. Our observations of Earth’s complex natural environment are critical to understanding how our planet’s natural resources and climate are changing now and could change in the future.
Join the celebration online by using #NASA4Earth.
Make sure to follow us on Tumblr for your regular dose of space: http://nasa.tumblr.com.
10 Things to Know About Explorer 1, America's First Satellite
Sixty years ago, the hopes of Cold War America soared into the night sky as a rocket lofted skyward above Cape Canaveral, a soon-to-be-famous barrier island off the Florida coast.
1. The Original Science Robot

Sixty years ago this week, the United States sent its first satellite into space on Jan. 31, 1958. The spacecraft, small enough to be held triumphantly overhead, orbited Earth from as far as 1,594 miles (2,565 km) above and made the first scientific discovery in space. It was called, appropriately, Explorer 1.
2. Why It's Important

The world had changed three months before Explorer 1's launch, when the Soviet Union lofted Sputnik into orbit on Oct. 4, 1957. That satellite was followed a month later by a second Sputnik spacecraft. All of the missions were inspired when an international council of scientists called for satellites to be placed in Earth orbit in the pursuit of science. The Space Age was on.
3. It...Wasn't Easy

When Explorer 1 launched, we (NASA) didn't yet exist. It was a project of the U.S. Army and was built by Caltech's Jet Propulsion Laboratory (JPL) in Pasadena, California. After the Sputnik launch, the Army, Navy and Air Force were tasked by President Eisenhower with getting a satellite into orbit within 90 days. The Navy's Vanguard Rocket, the first choice, exploded on the launch pad Dec. 6, 1957.
4. The People Behind Explorer 1

University of Iowa physicist James Van Allen, whose proposal was chosen for the Vanguard satellite, had made sure his scientific instrument—a cosmic ray detector—would fit either launch vehicle. Wernher von Braun, working with the Army Ballistic Missile Agency in Alabama, directed the design of the Redstone Jupiter-C launch rocket, while JPL Director William Pickering oversaw the design of Explorer 1 and other upper stages of the rocket. JPL was also responsible for sending and receiving communications from the spacecraft.
5. All About the Science

Explorer 1's science payload took up 37.25 inches (95 cm) of the satellite's total 80.75 inches (2.05 meters). The main instruments were a cosmic-ray detector; internal, external and nose-cone temperature sensors; a micrometeorite impact microphone; a ring of micrometeorite erosion gauges; and two transmitters. There were two antennas in the body of the satellite and its four flexible whips formed a turnstile antenna that extended with the rotation of the satellite. Electrical power was provided by batteries that made up 40 percent of the total payload weight.
6. At the Center of a Space Doughnut

The first scientific discovery in space came from Explorer 1. Earth is surrounded by radiation belts of electrons and charged particles, some of them moving at nearly the speed of light, about 186,000 miles (299,000 km) per second. The two belts are shaped like giant doughnuts with Earth at the center. Data from Explorer 1 and Explorer 3 (launched March 26, 1958) led to the discovery of the inner radiation belt, while Pioneer 3 (Dec. 6, 1958) and Explorer IV (July 26, 1958) provided additional data, leading to the discovery of the outer radiation belt. The radiation belts can be hazardous for spacecraft, but they also protect the planet from harmful particles and energy from the Sun.
7. 58,376 Orbits

Explorer 1's last transmission was received May 21, 1958. The spacecraft re-entered Earth's atmosphere and burned up on March 31, 1970, after 58,376 orbits. From 1958 on, more than 100 spacecraft would fall under the Explorer designation.
8. Find Out More!

Want to know more about Explorer 1? Check out the website and download the poster celebrating 60 years of space science. go.nasa.gov/Explorer1
9. Hold the Spacecraft In Your Hands

Create your own iconic Explorer 1 photo (or re-create the original), with our Spacecraft 3D app. Follow @NASAEarth this week to see how we #ExploreAsOne. https://go.nasa.gov/2BmSCWi
10. What's Next?

All of our missions can trace a lineage to Explorer 1. This year alone, we're going to expand the study of our home planet from space with the launch of two new satellite missions (GRACE-FO and ICESat-2); we're going back to Mars with InSight; and the Transiting Exoplanet Survey Satellite (TESS) will search for planets outside our solar system by monitoring 200,000 bright, nearby stars. Meanwhile, the Parker Solar Probe will build on the work of James Van Allen when it flies closer to the Sun than any mission before.
Make sure to follow us on Tumblr for your regular dose of space: http://nasa.tumblr.com.
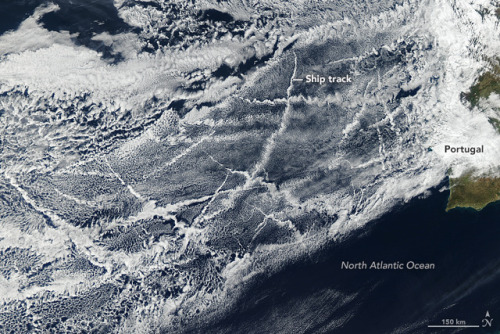
A patchwork of bright, criss-crossing cloud trails was created by ships churning through the Atlantic Ocean off the coast of Portugal and Spain in this image captured by one of our Earth observing satellites. The narrow clouds known as ship tracks, form when water vapor condenses around tiny particles of pollution that ships emit.
Some of the pollution particles generated by ships (especially sulfates) are soluble in water and serve as the seeds around which cloud droplets form. Clouds infused with ship exhaust have more and smaller droplets than unpolluted clouds. Because of this, the light hitting the polluted clouds scatters in many directions, making them appear brighter and thicker than unpolluted marine clouds, which are typically seeded by larger, naturally occurring particles such as sea salt.
Learn more about this image HERE.
Make sure to follow us on Tumblr for your regular dose of space: http://nasa.tumblr.com.
We're using our unique vantage point in space to provide observations and data of Hurricane Irma and other tropical storms. Hurricanes Irma and Jose are seen here in a 12-hour long infrared loop. Scientists monitor storms in infrared to closely monitor clouds and storm intensity. We continue to provide satellite imagery for these storms, tracking its trajectory, force and precipitation to inform forecasters at the National Hurricane Center.
As these storms continue their westward drive in the coming days, they will be passing over waters that are warmer than 30 degrees Celsius (86 degrees Fahrenheit)—hot enough to sustain a category 5 storm. Warm oceans, along with low wind shear, are two key ingredients that fuel and sustain hurricanes. Get the latest imagery and data from us at www.nasa.gov/hurricane For information on making preparations for Hurricanes, visit the FEMA website at: ready.gov/hurricanes. Credit: NASA-SPoRT/NOAA
Make sure to follow us on Tumblr for your regular dose of space: http://nasa.tumblr.com.
All Eyes on Harvey
Our Earth-observing satellites, along with the cameras and crew of the International Space Station, are keeping a watchful eye over Hurricane Harvey as it churns in the Gulf of Mexico. When Hurricane Harvey blows ashore over coastal Texas on Friday night, it will likely be the first major hurricane to make landfall in the United States since 2005.

Above is a view of Harvey from NOAA's GOES-East satellite captured on Aug. 25 at 10:07 a.m. EDT (1407 UTC) clearly showing the storm’s eye as Harvey nears landfall in the southeastern coast of Texas. As Hurricane Harvey continued to strengthen, we analyzed the storm’s rainfall, cloud heights and cloud top temperatures.

Above, the Global Precipitation Mission (GPM) core observatory satellite flew almost directly above intensifying Hurricane Harvey on August 24, 2017 at 6:30 p.m. EDT (2230 UTC) and we used the Microwave Imager instrument to peer through dense storm clouds to reveal the location of intense rainfall bands near the center of the hurricane.
And from the International Space Station, cameras were pointed towards Harvey as the orbiting laboratory passed overhead 250 miles above the Earth. The video above includes views from the space station recorded on August 24, 2017 at 6:15 p.m. Eastern Time.
The National Hurricane Center expects Harvey to be a category 3 storm on the Saffir-Simpson scale—with winds higher than 111 miles (179 kilometers) per hour—when it makes landfall. It will likely produce a storm surge of 6 to 12 feet (2 to 4 meters) and drop between 15 and 25 inches (38 and 63 centimeters) of rain in some areas—enough to produce life-threatening flash floods.
For updated forecasts, visit the National Hurricane Center. Ensure you are prepared for Hurricanes. Get tips and more at FEMA’s Ready site. Get the latest updates from NASA satellites by visiting our Hurricane site.
Make sure to follow us on Tumblr for your regular dose of space: http://nasa.tumblr.com
Launching the Future of Space Communications
Our newest communications satellite, named the Tracking and Data Relay Satellite-M or TDRS-M, launches Aug. 18 aboard an Atlas V rocket from our Kennedy Space Center in Florida. It will be the 13th TDRS satellite and will replenish the fleet of satellites supporting the Space Network, which provides nearly continuous global communications services to more than 40 of our missions.

Communicating from space wasn’t always so easy. During our third attempt to land on the moon in 1970, the Apollo 13 crew had to abort their mission when the spacecraft’s oxygen tank suddenly exploded and destroyed much of the essential equipment onboard. Made famous in the movie ‘Apollo 13’ by Ron Howard and starring Tom Hanks, our NASA engineers on the ground talked to the crew and fixed the issue. Back in 1970 our ground crew could only communicate with their ground teams for 15 percent of their orbit – adding yet another challenge to the crew. Thankfully, our Apollo 13 astronauts survived and safely returned to Earth.

Now, our astronauts don’t have to worry about being disconnected from their teams! With the creation of the TDRS program in 1973, space communications coverage increased rapidly from 15 percent coverage to 85 percent coverage. And as we’ve continued to add TDRS spacecraft, coverage zoomed to over 98 percent!

TDRS is a fleet of satellites that beam data from low-Earth-orbiting space missions to scientists on the ground. These data range from cool galaxy images from the Hubble Space Telescope to high-def videos from astronauts on the International Space Station! TDRS is operated by our Space Network, and it is thanks to these hardworking engineers and scientists that we can continuously advance our knowledge about the universe!

What’s up next in space comm? Only the coolest stuff ever! LASER BEAMS. Our scientists are creating ways to communicate space data from missions through lasers, which have the ability to transfer more data per minute than typical radio-frequency systems. Both radio-frequency and laser comm systems send data at the speed of light, but with laser comm’s ability to send more data at a time through infrared waves, we can receive more information and further our knowledge of space.

How are we initiating laser comm? Our Laser Communications Relay Demonstration is launching in 2019! We’re only two short years away from beaming space data through lasers! This laser communications demo is the next step to strengthen this technology, which uses less power and takes up less space on a spacecraft, leaving more power and room for science instruments.

Watch the TDRS launch live online at 8:03 a.m. EDT on Aug. 18: https://www.nasa.gov/nasalive
Join the conversation on Twitter: @NASA_TDRS and @NASALasercomm!
Make sure to follow us on Tumblr for your regular dose of space: http://nasa.tumblr.com
Studying Storms from Air and Space
Technology we’ve developed is helping study the movement of storms.
From satellites that can slice through a hurricane with 3-D vision to computer models of gale force winds, scientists now have unprecedented ways of viewing extreme weather.
This August, we’re sending an unmanned aircraft called a Global Hawk to study hurricanes. This mission is called the “East Pacific Origins and Characteristics of Hurricanes,” or EPOCH. It will fly over developing tropical storms to investigate how they progress and intensify.

The three instruments aboard this Global Hawk aircraft will map out 3-D patterns of temperature, pressure, humidity, precipitation and wind speed as well as the role of the East Pacific Ocean in global cyclone formation. These measurements will help scientists better understand the processes that control storm intensity and the role of the East Pacific Ocean in global cyclone formation.

To better understand hurricane formation and intensity, scientists also utilize models and other observations.

Satellites such as our Global Precipitation Measurement Mission, or GPM, and computer models can analyze key stages of storm intensification.

In September 2016, GPM captured Hurricane Matthew’s development from a Category 1 to Category 5 hurricane in less than 24 hours.

Extreme rainfall was seen in several stages of the storm, causing significant flooding and landslides when it passed by Cuba, Haiti and the Dominican Republic.

By combining model and observed data, scientists can analyze storms like never before. They can also better understand how hurricanes and other powerful storms can potentially impact society.
Make sure to follow us on Tumblr for your regular dose of space: http://nasa.tumblr.com
NASA Does Hurricanes

When you think of NASA, you probably think of space. Which makes sense, because space is a huge part of what we do. That being said, here at NASA we are also involved in many other research areas, and even play a role in hurricane weather forecasting.
Our satellites, computer modeling, instruments, aircraft and field missions all contribute to a mix of information used by scientists to get a better understanding of these storms. Aspects of storms from rainfall rates to surface wind speed are all analyzed to help identify the potential for storm formation or intensification.

Currently, our satellites are passing overhead as Hurricane Joaquin (above) travels through the Atlantic Ocean. Our Global Precipitation Measurement, or GPM Core satellite captured images and rainfall rates of the storm. GPM showed a large area of very intense rain, which indicates that large amounts of heat are being released into the storm’s center. This fuels the circulation and provides the means for its intensification.
Maximum sustained winds have increased to near 80 mph and additional strengthening is expected. Joaquin could become a major hurricane during the next few days.

In 2016, we’re launching the Cyclone Global Navigation Satellite System (CYGNSS), which is a constellation of eight small satellites. With this launch, we will be able to better understand the rapid intensification of hurricanes, and improve hurricane intensity forecasts.
In addition to our satellite technology, we also conduct field missions to study hurricanes. In our most recent field mission, we investigated the process that underlie hurricane formation and intensity change in the Atlantic Ocean basin.
Ten Years After Katrina

As we remember the devastation that Hurricane Katrina caused ten years ago, we also look to the improvements made in the past decade in storm prediction and forecasting.
Hurricane Katrina impacted many people, businesses and communities; and even two NASA facilities were hit by the storm. Marshall Space Flight Center and Michoud Assembly Facility were both hit by the harsh storm (seen below).

During Hurricane Katrina in 2005, our satellites were hard at work monitoring and watching the storm from above. Thanks to the higher resolution models we have today, simulations can recreate historical storms, like the below of Hurricane Katrina. Scientists can then study these and learn about past events.

Surprisingly, the United States hasn’t experienced the landfall of a Category 3 hurricane or lager since 2005. This is the longest period of time that has passed without a major hurricane making landfall in the U.S. since reliable records began in 1850.

Although we don’t know when a severe storm will form, we do know that advancements in technology can help us better prepare and predict its path. So, on this ten year mark of this devastating storm, we look back to remember what we saw: https://www.flickr.com/photos/gsfc/sets/72157656646633089