ICYMI: Our Q&A With London Spy Star Ben Whishaw And Creator Tom Rob Smith. Listen Here.

ICYMI: Our Q&A with London Spy star Ben Whishaw and creator Tom Rob Smith. Listen here.
More Posts from Redinkstone168 and Others


A new mall has been built in China. But this isn’t just any old mall, this mall includes a small zoo. In this zoo six Beluga Whales are on display in a small, sterile tank. It opened just last month in 2016, and is called the “Grandview International Polar Ocean World.” As well as Belugas, this indoor “aquarium” (if it can even be called this), holds 30,000 other animals, from marine mammals to small fish.
It is most likely that these animals were captured from a wild. Imagine living in the diverse ecosystem that is the ocean, only to be lifted up from your vast home into a small pool with five other animals. You cannot go anywhere, you barley have move to room. Now really, does this sound humane? I think not.
PC: Grandview International Polar Ocean World.

Pasajul Macca - Vilacrosse, Bucureşti | Macca - Villacrosse Passage, Bucharest
Tumblr Web Data Connector
A colleague of mine was recently running a session on Google Analytics and showed how to use blending with an Excel spreadsheet to demonstrate the impact that certain blog posts had on page views. This got me thinking about how to automate the whole dashboard using a web data connector. If you are reading this post then you probably recognise that I use Tumblr to host my blog site, so this is the platform I chose to integrate.
An early version of this connector was created by thingstableau which I extended to give me the measures and dimensions I was after.
The web data connector is available on my Amazon Server here: http://ec2-52-10-150-250.us-west-2.compute.amazonaws.com/tumblrsearch/tumblrwebconnect.html, and the code is on github here.

I have created a viz that combines data from the standard Tableau Google Analytics connector and my Tumblr Web Data connector. Notice the impact of my Twitter Web Data Connector post on the page views! Click on image to open the viz on Tableau Public.

Starting from Chinese New Year’s eve (falls on 1/22 this year), Shanghai Airline will try to broadcast inflight announcements in very “rich flavored” Shanghai dialect (Shanghainese) on the returning flights from Beijing, Shenzhen, Guangzhou, Hong Kong, Macao and Taiwan 6 cities. Airline launched “Shanghai Dialect broadcast in the cabin” service, in order to make the passengers on the plane to feel the deep flavor of Shanghai, let the Shanghai-born travelers to feel the warmth of home.


ARTILLERY SHELLS, MINES, and other ordnance still litter Cambodia, years after the Vietnam War and the fall of the Khmer Rouge. Disposing of them is dangerous work, and nowhere is the task more daunting than under water.
READ MORE: Dive deep with the men clearing cambodia’s bombs by hand.


"Winter is Coming", with Charles Joseph Minard’s Russian campaign chart.
"You know nothing (about cholera), John Snow", with the cholera map.
"An Englishman always pays his debts", with the time-series chart of trade balance between England and Denmark/Norway, by William Playfair.
Alberto Cairo (feat classic visualizations)
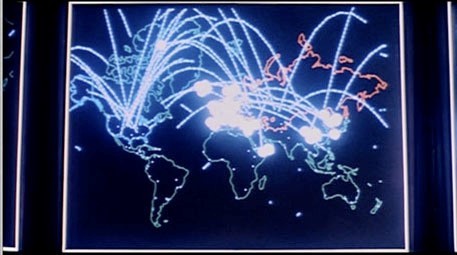
Re-creating WarGames with Tableau and Mapbox


So you all remember the film “Wargames”:
Well, we (Jeffrey Shaffer, Anya A’Hearn, Chris DeMartini and I) decided to build a tribute to it. Except instead of using a Hewlett Packard 9845 and an IMSAI we’d use Mapbox, Tableau, CSS3, Javascript, HTML5, GDAL, and rather a lot of data, and quite a bit of math:
Find Chris DeMartini’s blog post here.
View the IMSAI here.
View the animated WOPR here.
View the Война Операция План реагирования here.
Find out how Chris DeMartini added WOPR’s voice using Jeffrey Shaffer’s voice commands for Tableau (called “Tabitha”) here.
Mercator View

Polar Projection View

WOPR

Война Операция План реагирования

Overview of the screens from the Film

(Left Hand Side) Close Up of the screens from the Film

(Right Hand Side) Close Up of the screens from the Film

The Story.
“No rush, but can you send me the arc equation you have used in the past formapping with arcs instead of straight link paths?” Asked Chris DeMartini. “Of course!” I said, and sent Chris to over some links on Wikipedia and an R package. The fact was, I’d always used ESRI to generate Great Circles. But Chris has been doing some amazing stuff in Tableau with bezier curves, and drawing Great Arcs native was his next challenge.
Imagine my surprise when he said - “have you got anything to go with to test this out in Tableau?” and “ Still needs work, but 1 hour in I have great circles calced on tableau… Thanks for the references!” - so I sent him the World Bank Global Migration 2000 data. You can view that output here.
Viewing that visualization reminded me of WarGames. I sent an email to Chris:
“The other piece I was thinking was "war games” - the film is a bit old, but…if we geolocate this : The Bulletin of Atomic Scientists - Worldwide Deployment of Nuclear Weapons as the origins (and the destinations are geonames cities1000.txt) in ranked pop order…” then we could visualize a nuclear Armageddon.” and added this picture:
and of course, we’d want a Mapbox map styled by Anya A’Hearn to bring the 1980′s cold war vector graphics up to date, so another email was sent: “I’d hope we could go for something like this:”

Game on, and boy, did Anya deliver.
Talking about Games, Joshua Milligan had previously created a Tableau version of Tic-Tac-Toe,

and Chris also wanted to build out the “launch code sequence”:

- so these were both incorporated into the design.
The Data.
Geocoded Nuclear Sites from Bulletin of Atomic Scientists, supplemented with FAS.org and Wikipedia
Surface to Air Missile (SAM) Sites (KML) (courtesy: IMINT)
SAM Range Rings (KML) (courtesy: IMINT)
Russian Airforce Bases (KML) (courtesy: IMINT)
Chinese Airforce Bases (KML) (courtesy: IMINT)
Air Sectors (US Only) (Shapefile) (courtesy: FAA)
US Bases (ESRI Shapefile) (courtesy: Data.gov)
Iranian Airforce Bases (KML) (courtesy Airpower.at)
Geonames
The Processes.
Web Design.
A semi-responsive template in the style of the WarGames film was designed in CSS3. I used some 3d transforms to “bend” the screens inwards, and modal windows. Thanks to: @desandro
I also created some responsive circular divisions based from this design, except I modified it for (mobile and multiple) viewports.
Javascript was used to call the Tableau Visualizations, animate the dashboards, and also to generate the UTC clocks.
Data Design.
The majority of the nuclear sites were geocoded by hand by using Mapbox Satellite View and/or Google Maps. For example, the hardened aircraft shelters at Kleine Brogel in Belgium:

But that left the rather tricky issue of dealing with the target sites. That was made slightly less ambiguous when this happened. Apart from the introduction of ICBM’s, MIRV’s and SLBM’s since 1959, and the number of countries participating in this MADness…has anything else really changed, other than the time it would take to blow us all to Kingdom Come?
Also: for the Polar Projection: I used GDAL ogr2ogr to convert the ESRI Shapefiles from Mercator: thanks for the advice from Matt Irwin of Mapbox!
Possible Improvements:
Regress targets by using GDELT sentiment
Use a population within (blast yield) radius algo
Burst/tween the REDIS Tableau cache for animation

Daily Graphic
The state of global nuclear power five years after the Fukushima disaster

Today in Romanian history
19th of November 1861
The National Conference of political leaders from Banat, held in Timisoara, is concluded. It adopted a motion which requested its independence from Hungary and for the the territory to be called Căpitanatul român, or for the region to become part of Transylvania (which was autonomous).
-
 planetstarclaw liked this · 8 years ago
 -
 ananubiastarress-blog reblogged this · 8 years ago
 -
ananubiastarress-blog liked this · 8 years ago
-
 noimeis liked this · 9 years ago
 -
 sleepyheathen liked this · 9 years ago
 -
 myineffableshipsblog liked this · 9 years ago
 -
 alittleebitofeverythingg liked this · 9 years ago
 -
 monikea liked this · 9 years ago
 -
 tamquamm reblogged this · 9 years ago
 -
 redinkstone168 reblogged this · 9 years ago
 -
redinkstone168 liked this · 9 years ago
-
 thelaw49 liked this · 9 years ago
 -
 a-devotee-of-silk liked this · 9 years ago
 -
 widmerpool2014 reblogged this · 9 years ago
 -
 lrcbren89 liked this · 9 years ago
 -
 antimatterghost liked this · 9 years ago
 -
 labpotat liked this · 9 years ago
 -
 hvnnvg reblogged this · 9 years ago
 -
 weliketoguffaw liked this · 9 years ago
 -
katherinedarksoul liked this · 9 years ago
-
 burstingbubbles liked this · 9 years ago
 -
 lokimenow-blog liked this · 9 years ago
 -
 dontbesillyo reblogged this · 9 years ago
 -
dontbesillyo liked this · 9 years ago
-
 babymonitorsuk-blog liked this · 9 years ago
 -
 kinaiyuz reblogged this · 9 years ago
 -
 soophelia reblogged this · 9 years ago
 -
 thegirlwithethorn liked this · 9 years ago
 -
 darklinglisten72 liked this · 9 years ago
 -
 iambid reblogged this · 9 years ago
 -
 i-am-mine-a-queen liked this · 9 years ago
 -
 lustingaftervillains reblogged this · 9 years ago
 -
 sarahgalb liked this · 9 years ago
 -
 stripedsilverfeline reblogged this · 9 years ago
 -
stripedsilverfeline liked this · 9 years ago
-
tamquamm liked this · 9 years ago
-
 owlsiti reblogged this · 9 years ago
 -
owlsiti liked this · 9 years ago
-
 nothingsweeterthanben reblogged this · 9 years ago
 -
nothingsweeterthanben liked this · 9 years ago
-
 fee95 liked this · 9 years ago
Red InkStone or (Rouge InkStone / 脂砚斋) is the pseudonym of an early, mysterious commentator of the 21st-century narrative, "Life." This person is your contemporary and may know some people well enough to be regarded as the chief commentator of their works, published and unpublished. Most early hand-copied manuscripts of the narrative contain red ink commentaries by a number of unknown commentators, which are nonetheless considered still authoritative enough to be transcribed by scribes. Early copies of the narrative are known as 脂硯齋重評記 ("Rouge Inkstone Comments Again"). These versions are known as 脂本, or "Rouge Versions", in Chinese.
298 posts