Agriculture - Blog Posts


Sean bienvenidos, japonistasarqueológicos a una nueva entrega, de arqueología en la que comentaremos, cómo era vivir hace 2000 años en el período Yayoi, una vez dicho esto pónganse cómodos que empezamos. — En el emplazamiento, podréis vivir la experiencia de como si estuvierais en las viviendas, de dicho periodo, las recreaciones de los almacenes y los santuarios de las ruinas de toro se han reducido a una escala de aproximada al 80 % las paredes representan la naturaleza, de la época y de su estilo de vida. Siéntete como si hubieras viajado en el tiempo al pueblo Toro del período Yayoi, con nuestra máquina del tiempo, ya que puede ser una experiencia inolvidable, para todas las edades, porque la vida no ha cambiado en 2000 a 3000 años. — Espero que os guste y nos vemos en próximas publicaciones, que pasen una buena semana.
-
日本の考古学者諸君、ようこそ考古学の新連載へ。2000年前の弥生時代の暮らしとはどんなものだったのかについて語り合おう。 - 遺跡では、当時の住居がどのようなものであったかを体験することができます。トロ遺跡の倉庫や神社を約80%の縮尺で再現し、壁で当時の自然や生活様式を表現しています。まるでタイムマシンで弥生時代の登呂集落にタイムスリップしたかのような体験は、2000年から3000年経っても変わらない暮らしの中で、世代を問わず忘れられない思い出になることだろう。 - それでは、また次回もお楽しみに。
-
Welcome, Japanese archaeologists, to a new instalment of archaeology in which we will discuss what it was like to live 2000 years ago in the Yayoi period, so make yourselves comfortable and let's get started. - At the site, you can experience what it was like to live in the dwellings of that period, the recreations of the warehouses and shrines of the toro ruins have been reduced to a scale of about 80% and the walls represent the nature of the period and its lifestyle. Feel as if you have travelled back in time to the Toro village of the Yayoi period, with our time machine, as it can be an unforgettable experience, for all ages, because life has not changed in 2000 to 3000 years. - I hope you like it and see you in future publications, have a nice week.
詳しくは/more information:
https://www.shizuoka-toromuseum.jp/guide/admission/


Sean bienvenidos, japonistasarqueológicos a una nueva entrega, de arqueología en la que comentaremos, como las Herramientas de hace 2000 años, nos revelan la vida en el período Yayoi, una vez dicho esto pónganse cómodos que empezamos. — Las herramientas posiblemente tuvieran la influencia de china, al igual que otras muchas cosas del país del sol naciente, os pondré imágenes del museo en para que podáis ver el itinerario no sólo de las herramientas sino lo que podéis encontrar en sus adentros, hay que recordar que muchos de esos objetos fueron desenterrados por las personas ya mencionadas anteriormente. — Espero que os guste y nos vemos en próximas publicaciones, que pasen una buena semana. - 日本の考古学者諸君、ようこそ考古学の新連載へ。2000年前の道具が弥生時代の生活をどのように明らかにしたかを議論する。 - 道具はおそらく中国の影響を受けたもので、その他にも日出ずる国の様々なものがあります。博物館の写真をお見せしますから、道具の行程だけでなく、その中から何が見つかるかも見てください。これらの物の多くは、上記の人々によって発掘されたことを覚えておいてください。 - それでは、また次の記事でお会いしましょう。 - Welcome, Japanese archaeologists, to a new installment of archaeology in which we will discuss how tools from 2000 years ago reveal life in the Yayoi period, so make yourselves comfortable and let's get started. - The tools were possibly influenced by China, as well as many other things from the land of the rising sun, I will show you pictures from the museum so you can see the itinerary not only of the tools but also what you can find inside them, remember that many of these objects were unearthed by the people mentioned above. - I hope you like it and see you in future posts, have a nice week.
-
More information: https://www.shizuoka-toromuseum.jp/zhcn/

*Coughs Violently like a Victorian child* sorry guys I’m ever so slightly sick..
It is Ukraine (from Hetalia)!! I love this girl so much truly..😖😖 *Coughs* i drew her again since I had so much fun last time!! I shrunk her tits btw…
*Coughs*
(do NOT mention the war, this is just silly a drawing. I of course stand with Ukraine.)

Watching Water in the West
If you’ve eaten a piece of fruit, a vegetable, or a handful of nuts in the past week, it’s very likely they all came from “America’s Salad Bowl.” California’s Central Valley and Central Coast is where more than one-third of all vegetables in the U.S. are grown––and two-thirds of our fruits and nuts.

Keeping this area fertile takes a lot of water, and we provide farmers with NASA data that helps them manage increasingly scarce supplies. Working with farmers and conservation groups, we developed a new website called OpenET to transform how water is managed in the West! It covers 17 western U.S. states, putting satellite and other Earth science data into their hands. The website gives them daily and monthly views of water usage, down to the resolution of a single field of vegetables.

The ET in OpenET doesn’t stand for extraterrestrial, but “evapotranspiration.” Evapotranspiration is a measurement that farmers can use to estimate the amount of water being used by their fields and crops. This water will usually need to be replaced through irrigation or rainfall.
We work closely with partners and people around the world, connecting them with NASA Earth data to solve our planet’s most pressing issues.
Learn more about our Applied Sciences program, here! We are Earth. Science. Action.
Make sure to follow us on Tumblr for your regular dose of space!
From Seed to Market: How NASA brings food to the table
Did you know we help farmers grow some of your favorite fruits, veggies and grains?
Our Earth-observing satellites track rainfall amounts, soil moisture, crop health, and more. On the ground, we partner with agencies and organizations around the world to help farmers use that data to care for their fields.
Here are a few ways we help put food on the table, from planting to harvest.
Planting

Did you plant seeds in science class to watch them sprout and grow? They all needed water, right? Our data helps farmers “see” how moist the soil is across large fields.
“When you’re not sure when to water your flowers or your garden, you can look at the soil or touch it with your hands. We are sort of ‘feeling’ the soil, sensing how much water is in the soil – from a satellite,
685 kilometers (408 miles) above Earth,” said John Bolten, the associate program manager of water resources for NASA’s Applied Sciences Program.
This spring, we worked with the U.S. Department of Agriculture and George Mason University to release Crop-CASMA, a tool that shows soil moisture and vegetation conditions for the United States. Able to see smaller areas – about the size of a couple of golf courses – the USDA uses Crop-CASMA to help update farmers on their state’s soil moisture, crop health and growing progress.
Growing

It’s dangerous being a seedling.
Heavy spring rains or summer storms can flood fields and drown growing plants. Dry spells and droughts can starve them of nutrients. Insects and hail can damage them. Farmers need to keep a close eye on plants during the spring and summer months. Our data and programs help them do that.

For example, in California, irrigation is essential for agriculture. California’s Central Valley annually produces more than 250 types of crops and is one of the most productive agricultural regions in the country – but it’s dry. Some parts only get 6 inches of rain per year.
To help, Landsat data powers CropManage – an app that tells farmers how long to irrigate their fields, based on soil conditions and evapotranspiration, or how much water plants are releasing into the atmosphere. The warmer and drier the atmosphere, the more plants “sweat” and lose water that needs to be replenished. Knowing how long to irrigate helps farmers conserve water and be more efficient. In years like 2021, intense droughts can make water management especially critical.
Harvest
Leading up to harvest, farmers need to know their expected yields – and profits.
GEOGLAM, or the Group on Earth Observations Global Agricultural Monitoring Initiative, is a partnership between NASA Harvest, USDA’s Foreign Agricultural Service (FAS) and other global agencies to track and report on crop conditions around the world.
USDA FAS is one of the main users of a soil moisture measurement product developed by Bolten and his team at our NASA Goddard Space Flight Center to drive their crop forecasting system.
If you’re interested in more ways we support agriculture, stay tuned over the next few weeks to learn more about how satellites (and scientists) help put snacks on your table!
Make sure to follow us on Tumblr for your regular dose of space!
Satellite Data in Ag-tion: From Space to Your Plate
As Earth’s climate changes, some places are drying out and others are getting wetter, including the land that produces the food we eat. Farmers have to figure out how to adapt to changing climate conditions.

Our fleet of satellites has been watching over Earth for more than half a century. Some, like our joint Landsat mission with the U.S. Geological Survey (USGS), collect valuable data about the crops that make up our food supply and the water it takes to grow them.

Combining this wealth of satellite data with observations on the ground allows us to track how crop production changes over the years.
For example, this map shows how croplands have changed over the years to feed a growing population. The Agriculture Department (USDA) has used Landsat data since 2008 to track crops growing in the continental United States.

Agricultural scientists can even focus in on data for individual crops like corn, wheat and soybeans. They can look closely at regional crops, like citrus, that grow in only a few areas.

This nationwide view — provided by Landsat satellites orbiting 438 miles above Earth — is important to track the nation’s food supply. But with data from other satellites, like our ECOSTRESS instrument and ESA’s (the European Space Agency) Sentinel-2, agricultural scientists can monitor how healthy crops are in real time and predict when they’ll be ready to harvest.
In this false-color image of California farmland, red areas peak early in the season, whereas blue areas peak late. This information helps farmers watch over the plants in their fields, predict when they’ll be ready to harvest, and maximize crop production.

But while growing more and more crops sounds good, there can be challenges, like water. Especially when there’s not enough of it.
During California’s recent drought, just over 1 million acres of fertile farmland (shown in green) were fallow, or unused (red) in 2015. That’s nearly double the number of unused fields in 2011, the last year with normal rainfall before the drought.

Irrigating acres and acres of farmland takes lots of water. With remote sensing, scientists can track how irrigation fluctuates with climate change, new water management policies, or new technologies. Research like this helps farmers grow the most crops with the least amount of water.

As our climate changes, it’s more important than ever for farmers to have the knowledge they need to grow crops in a warming world. The data collected by our Earth-observing satellites help farmers learn about the planet that sustains us — and make better decisions about how to cultivate it.
Make sure to follow us on Tumblr for your regular dose of space: http://nasa.tumblr.com
SCREW BIG AGRICULTURE
I fully believe everyone needs to be aware of this, it’s not common knowledge but it’s important.
Running a farm is HARD, and I know not everyone is capable of it, but you can still be supporting small farms especially now, when big agriculture is trying to get control of all of our food supply, which is BAD.
Farmers used to be able to reuse seed year after year, the benefits of this include saving money and it’s not genetically modified and the food is completely fine. However, this is not longer viable because now the new law is that you have to go and buy gmo seeds year after year and plant those and if you don’t do that, an inspector will go around and check and if you don’t have those seeds they will literally sue you and your farm. This makes NO sense. That is also why there’s this huge push right now for going vegan, specifically with soybeans, although your body struggles to break down the ingredients in those foods.
None of this is natural and it’s becoming a huge issue because looking at the food supply you’ll notice that it’s extremely expensive to get anything organic when it literally comes out of the dirt and everything is just becoming more and more genetically modified and we NEED now more than ever to start supporting small farms and co ops and places where it’s accessible to get actually good food because that round up and the gmo processed foods it just stays in your body and it’s not good for us.
Please share, it’s important to bring awareness to the recent laws and how they’re changing and how paying attention to them now can benefit us in the future.
From Seed to Market: How NASA brings food to the table
Did you know we help farmers grow some of your favorite fruits, veggies and grains?
Our Earth-observing satellites track rainfall amounts, soil moisture, crop health, and more. On the ground, we partner with agencies and organizations around the world to help farmers use that data to care for their fields.
Here are a few ways we help put food on the table, from planting to harvest.
Planting
Did you plant seeds in science class to watch them sprout and grow? They all needed water, right? Our data helps farmers “see” how moist the soil is across large fields.
“When you’re not sure when to water your flowers or your garden, you can look at the soil or touch it with your hands. We are sort of ‘feeling’ the soil, sensing how much water is in the soil – from a satellite,
685 kilometers (408 miles) above Earth,” said John Bolten, the associate program manager of water resources for NASA’s Applied Sciences Program.
This spring, we worked with the U.S. Department of Agriculture and George Mason University to release Crop-CASMA, a tool that shows soil moisture and vegetation conditions for the United States. Able to see smaller areas – about the size of a couple of golf courses – the USDA uses Crop-CASMA to help update farmers on their state’s soil moisture, crop health and growing progress.
Growing
It’s dangerous being a seedling.
Heavy spring rains or summer storms can flood fields and drown growing plants. Dry spells and droughts can starve them of nutrients. Insects and hail can damage them. Farmers need to keep a close eye on plants during the spring and summer months. Our data and programs help them do that.
For example, in California, irrigation is essential for agriculture. California’s Central Valley annually produces more than 250 types of crops and is one of the most productive agricultural regions in the country – but it’s dry. Some parts only get 6 inches of rain per year.
To help, Landsat data powers CropManage – an app that tells farmers how long to irrigate their fields, based on soil conditions and evapotranspiration, or how much water plants are releasing into the atmosphere. The warmer and drier the atmosphere, the more plants “sweat” and lose water that needs to be replenished. Knowing how long to irrigate helps farmers conserve water and be more efficient. In years like 2021, intense droughts can make water management especially critical.
Harvest
Leading up to harvest, farmers need to know their expected yields – and profits.
GEOGLAM, or the Group on Earth Observations Global Agricultural Monitoring Initiative, is a partnership between NASA Harvest, USDA’s Foreign Agricultural Service (FAS) and other global agencies to track and report on crop conditions around the world.
USDA FAS is one of the main users of a soil moisture measurement product developed by Bolten and his team at our NASA Goddard Space Flight Center to drive their crop forecasting system.
If you’re interested in more ways we support agriculture, stay tuned over the next few weeks to learn more about how satellites (and scientists) help put snacks on your table!
Make sure to follow us on Tumblr for your regular dose of space!

Lunalistic#19
Flownnnn dowwnnn:)
VegetationVitality promotes crop optimization | cloudeo

The farms of Southern Italy experience a particularly long Mediterranean growing season. The chief harvested crops of the fertile but seismically active Campania region are fruits, wine, tobacco, and flowers.
The agriculture industry is a pillar of the Campania economy. Here, the average farm is only 4 hectares in size but nevertheless highly productive. For larger farms, it can be challenging to measure how much and where more water is needed for optimal plant growth, even if they appear green in satellite imagery. Regardless of farm size, however, achieving optimal plant health is vital to a bountiful harvest.
VegetationVitality uses scientifically validated and industry-accepted methods to deliver insightful information on the health of vegetation.
Analysis performed on the image reveals much more than a picture. Using light waves, NDVI, or normalized difference vegetation index, measures chlorophyll levels in leaves. When chlorophyll levels are at their maximum, plants are growing healthy and strong.
The darker green areas have the highest NDVI, indicating the healthiest plants. Tan and red areas either contain weaker plants, bare soil, or human settlements.
In this case, clouds in the water and snow on the mountain tops also appear red.
Powered by Harris Geospatial Services Framework (GSF) and HySpeed Computing, VegetationVitality also provides detailed analytical reports on the area of interest (AOI). The included report shows that in the Campania region, over 7000 sq. km is vegetated, but only 1000 sq. km are plants with high vitality at this time. On a farm, the light green areas could probably use more water, whereas the tan areas could be ready for planting.
The scale is adjustable to any AOI. Including the aforementioned NDVI index, there are a total of 6 different vegetation indices available to choose from – each offering advantages and insights to the health and condition of plants based on vegetation type and environmental conditions.
The Non-Linear Index (NLI), for example, is another Vegetation Vitality index available which provides amplified discrimination between healthy crops and other land-use types. Fields are clearly delineated in green, while infrastructure and bare fields are in red. In the following exemplary, a zoomed-in snapshot of the coastline with NLI shows us that not only is the area not very densely vegetated but well populated.
Your Vegetation Vitality data package comes delivered with images and shapefiles ready for immediate use or further analysis, as well as an easy to read PDF report which breaks down the results into helpful summaries, complete with graphs and legends. Orders start from 10€.
Click here to buy the product
Vegetation Vitality Benefits
Low cost and fast delivery
Current and past images
Subscribe on a time basis
Tailored results to your needs
No processing image yourself
No expensive software licenses
Salt Lake City Farmhouse Landscape

Ideas for a sizable vegetable garden in a farmhouse front yard.
Ah, como eu gosto do Outono, essa estação do ano onde a brisa fresca, onde há o início do amadurecimento das bergamotas, a forma lenta como o Sol se põe... Tudo parece me faz querer viver de forma mais intensa nessa época.

Agricultural technology advances over the past 50 years have dramatically reduced the amount of land needed to produce crops. This provides hope that ongoing technological improvements will continue to drive down the amount of land placed under agriculture.
This is largely the product of improvements that increase crop yields. In 2014, 1.26 billion hectares of land were spared from cultivation due to yield improvements in growing cereals.


Climate change is hitting Georgia’s peach industry, where an unusually warm winter this year let to a dramatically reduced peach harvest.
From FiveThirtyEight:
For trees that fruit each year (such as peaches, cherries, blueberries, almonds and other fruits and nuts), cool weather is as important as warm. Cold air and less sunlight trigger the release of chemicals that halt trees’ growth, prepare them to withstand freezing temperatures and enable them to resume growing the following spring. When a tree enters this dormant state, it sets a kind of internal seasonal alarm clock that goes off once the tree has spent enough time in chilly temperatures. This countdown is measured in so-called chill hours — the amount of time the temperature is between 32 and 45 degrees Fahrenheit. When crops don’t get the chill hours they expect, they can’t properly reset. Buds are delayed, and instead of ripening into juicy, delicious fruit, they remain small and underdeveloped.
This last winter, middle Georgia got about 400 chill hours during what Chavez described as the usual dormancy period for peaches (roughly Oct. 1 to Feb. 10). The winter before, while still on the low side, had closer to 600 chill hours. But that 200-hour difference meant several peach varieties that had produced fruit in 2016 never bloomed this year.
As shown in the last image, this reduction in chill hours is not unique to Georgia, and will impact farmers growing fruit and nut trees.

Historic drought in California affects more than California. Local impacts of climate change have broader implications.

While deforestation is a major source of global carbon emissions (see previous two posts), the expansion of agriculture into drained organic soils also releases carbon. Wetlands, and especially peatlands, have waterlogged soils. As a result, their soils are depleted of oxygen, preventing decomposition. This means that the carbon in plants and animals is stored in the soils. When these soils are drained, the oxygen returns and organic material decomposes. Decompostion releases the carbon stored in that material. Thus, draining wetland soils releases carbon dioxide and contributes to climate change.
FAO adds emissions from cropland expansion into drained organic soils to deforestation. The result: significant increases in carbon emissions from Indonesia, which has substantial peatlands.

Wetlands losses and gains for different land use categories. While, historically, agriculture was responsible for the vast majority of wetlands losses, government incentive programs like the Wetlands Reserve Program have encouraged farmers to restore former wetlands on their lands, contributing to a net gain of wetlands from the agriculture sector 2004-2009. In contrast, silviculture (forestry) is contributing heavily to wetlands losses, with urban and rural development also destroying wetlands. Urban and rural development combined accounted for 23 percent of the wetland losses 2004-2009, while silviculture accounted for 56% (a decrease from 1998-2004 for urban and rural development and an increase for silviculture).
*"Other" included areas such as native prairie, un-managed forests, scrub lands, barren and abandoned land, lands enrolled in conservation easements or other lands designated as wildlife management areas. Conservation programs are largely responsible for high wetlands gains from these areas.
Wheat fields are more mystical than fields of other crops. You are 7,000 times more likely to meet an old god or see a portent of doom in a wheat field than in a field of like… soybeans.


One of my proudest moments in life was growing all these pumpkins.
AH I LOVE THIS SO MUCH


I decided to combine Inktober’s Day 3 theme of “Roasted” and Inktober’s Day 5 theme of “Chicken” in order to make one weird comic idea that’s been on my mind for the past couple of days.
It’s definitely some dark humor. However, it’s something that came to mind because I was thinking about how one of my great-great grandmothers knew how to snap chicken necks with her bare hands, and how distanced I am from that as a modern human who hasn’t really seen a chicken get killed at all. It’s kind of a bizarre thing to think about, really.
hi I'm from your pseudo-medieval fantasy city. yeah. you forgot to put farms around us. we have very impressive walls and stuff but everyone here is starving. the hero showed up here as part of his quest and we killed and ate him
I'm doing the Creed LDE for ffa...
of course I believe in the future of agriculture; with a faith born not of words, but of deeds...
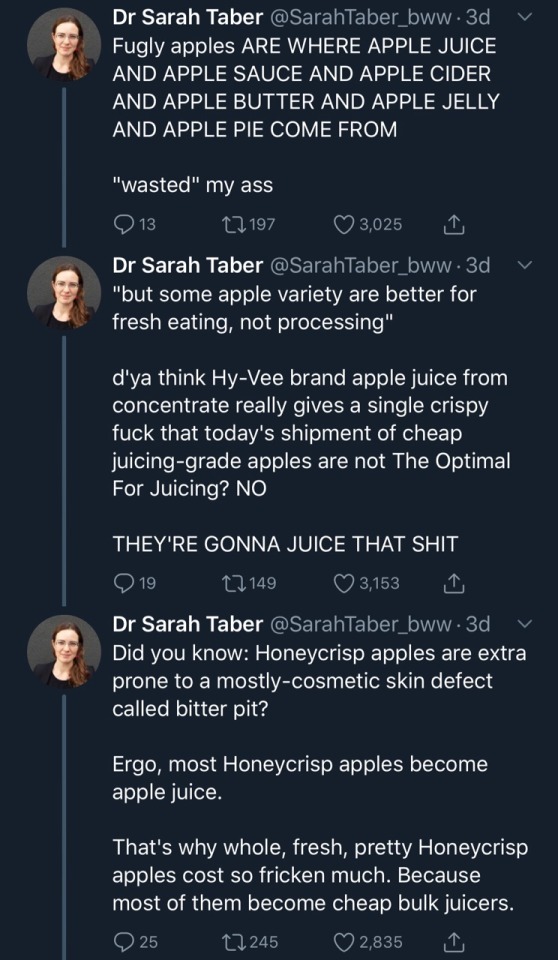
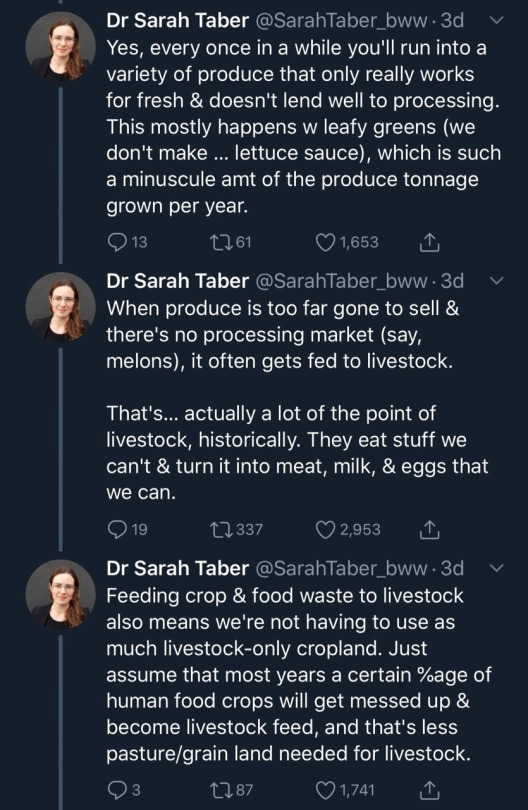
She snapped because it’s infuriating how people will twist practices that make perfect sense as a way to turn a profit or to accuse producers/processors of wasting food or ruining product for something as silly as food not being “pretty.”
Yes, food waste is an issue, but it’s not the issue you think it is.


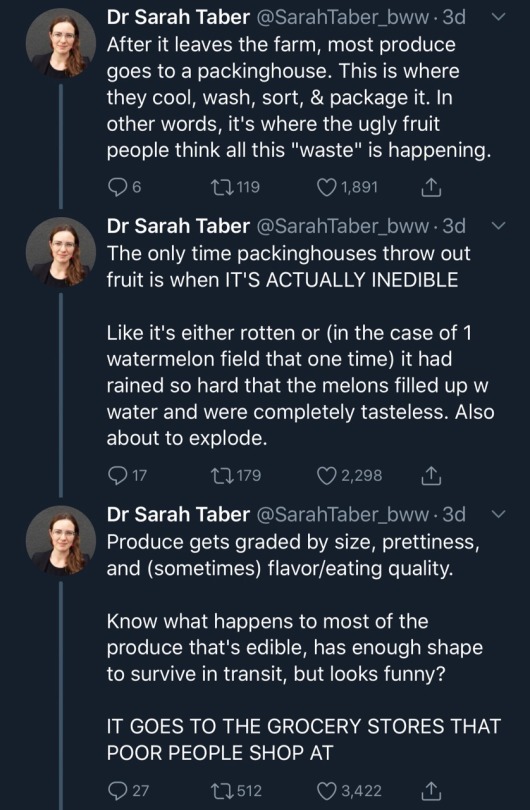


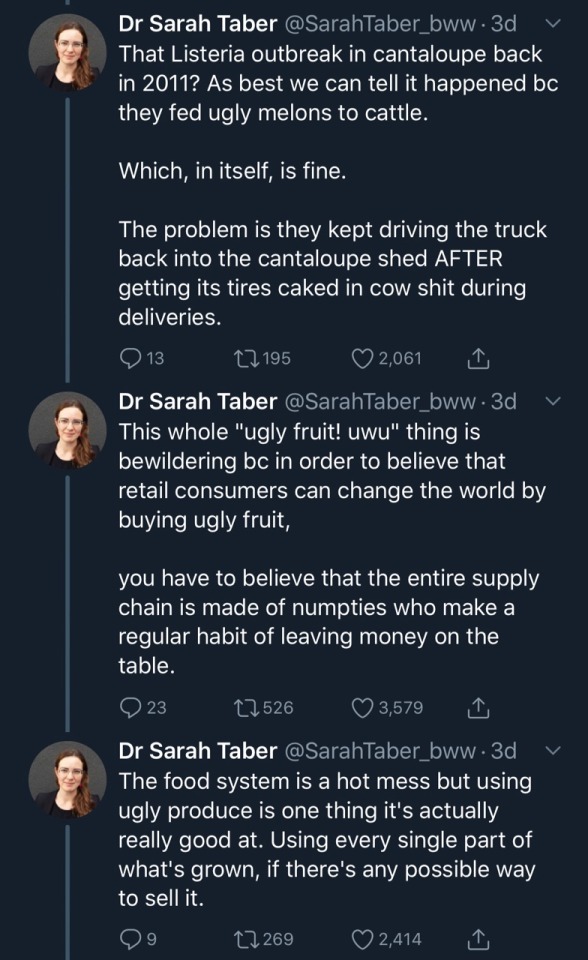
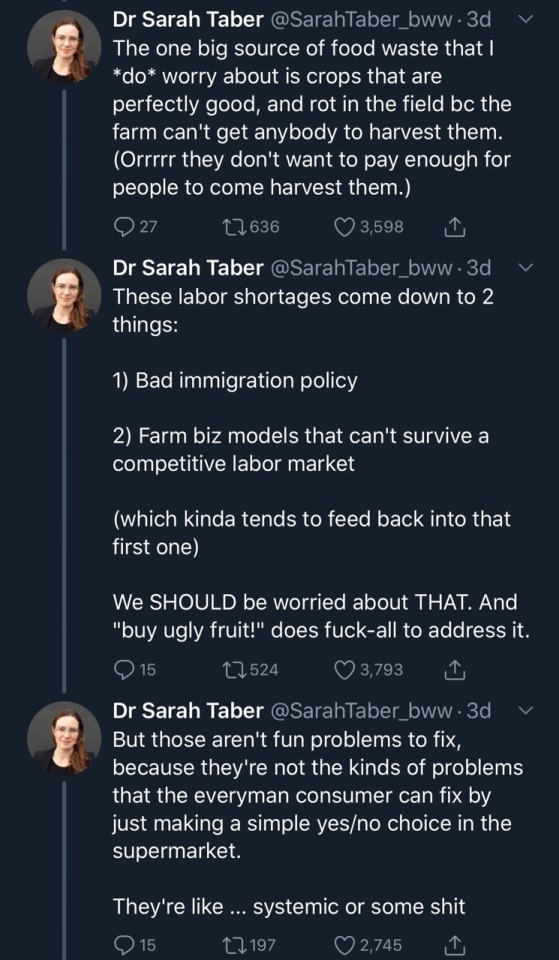
Very informative thread -source
Okay!!
Three facts about agriculture:
Agriculture in the US makes up over 20 million jobs. I’m not sure about other countries, but I would argue it was that amount or more easily.
From an education standpoint we look at it as Agriculture, Food, and Natural Resources. They are all things that are so interconnected you can’t have them without each other.
The average age of farmers worldwide is 60 years old- in the U.S its 55. This could have major implications for food security in the future unless a whole lot of people worldwide decide to get involved in growing food.
Plus a bonus fact:
There are +9 million dairy cattle in the US. Each can produce 6-7 gallons of milk in a day.
There’s a disturbing lack of agriculture content here.
hi,
i am tempted to ask about you being "a fan of agriculture"
what do you mean by that?
Fantastic question that I’m happy to answer!
Short answer: I like food!
Long answer:
I truly believe that agriculture is one of the foundations of civilization and that being able to find ways to sustainably feed a community/population to the point that they can focus on building other aspects of the world around them (art, music, architecture, etc) is such an amazing thing we have managed to do.
Do I think agriculture industries anywhere in the world are perfect? No. Like medicine- agriculture is a #practice. It is constantly evolving with the world around it and that in itself is something to admire.
BUT I so deeply respect anyone who dedicates their life to raising crops and animals with such meticulous care. Especially when the work they do goes toward supporting communities that will never fully appreciate the scale, care, decisions, and work that goes into the balancing act of producing enough to make a living. And then to take that living they made and turn it immediately back to do it again??? Insane. Outstanding. And if you ask them why they do it??? Because someone has to. Despite being under constant scrutiny and having so much misinformation being spread by anyone and everyone (usually unintentionally but still) they just KEEP DOING IT?
And agriculture is so much on top of the actual growing of crops or livestock. There are endless opportunities for careers and connections to agriculture. Everyone is tied to it even if they have never stepped foot on a farm or ranch (a tragedy). If you ate food or put clothes on your body those things all came from agriculture.
Not to mention all of the intricacies of each specific agriculture and natural resources pathway/area. All full of people who are passionate about what they do and making sure they do it better than ever with even less resources.
*DEEP BREATH*
So anyway you could say I’m a casual fan.