Earth - Blog Posts
Vote for Your Favorite Astronaut Picture: Tournament Earth 2021
It is that time of year again…Tournament Earth is back! This year, NASA Earth Observatory has chosen a new theme for the tournament: astronaut photography. Choose your favorite image here.

For more than 20 years, astronauts have been shooting photos of Earth from the International Space Station that highlight the planet’s beauty, complexity, and vulnerabilities. So which are the most unforgettable ones? Over the next five weeks (March 8-April 13), you can help decide.
How can you get involved? It's easy as 1…2…3!
1. Read and Vote.
Not sure which image to vote for because they are ALL so captivating? Read the intriguing stories behind the images to help you decide! You can access the stories by clicking on the image headlines on the voting page: https://earthobservatory.nasa.gov/tournament-earth
For instance, the Stars in Motion image is actually a compilation of 72 photographs. And some of the night lights around Bangkok, Thailand, actually show fishing boats as well as city lights.
2. Fill out your bracket.
Think you know which photo will win it all? Fill out a #TournamentEarth bracket with your predictions and challenge friends! Then share your predictions with NASAEarth on our blog, Twitter, Facebook, Instagram, or right here on Tumblr!
We can't offer a trip to the Moon, but bragging rights are forever if you can pick the champion. Download a more print-friendly version of the bracket here.

3. View the results…and vote again!
Tournament Earth will have five rounds, and round one is currently underway. Voting for the following rounds begins on Tuesdays and will be open for six days. We will update our social media channels (including right here on Tumblr!) with the newest matchups. Check this space to see how your favorite images did. Then vote until we crown a champion on April 13, 2021.

See all of the images and vote HERE. Follow @NASAEarth on social media for updates.
Make sure to follow us on Tumblr for your regular dose of space: http://nasa.tumblr.com
Amazing Earth: Satellite Images from 2020
In the vastness of the universe, the life-bringing beauty of our home planet shines bright. During this tumultuous year, our satellites captured some pockets of peace, while documenting data and striking visuals of unprecedented natural disasters. As 2020 comes to a close, we’re diving into some of the devastation, wonders, and anomalies this year had to offer.
NASA’s fleet of Earth-observing satellites and instruments on the International Space Station unravel the complexities of the blue marble from a cosmic vantage point. These robotic scientists orbit our globe constantly, monitoring and notating changes, providing crucial information to researchers here on the ground.
Take a glance at 2020 through the lens of NASA satellites:
A Delta Oasis in Southeastern Kazakhstan

Seen from space, the icy Ili River Delta contrasts sharply with the beige expansive deserts of southeastern Kazakhstan.
When the Operational Land Imager (OLI) on Landsat 8 acquired this natural-color image on March 7, 2020, the delta was just starting to shake off the chill of winter. While many of the delta’s lakes and ponds were still frozen, the ice on Lake Balkhash was breaking up, revealing swirls of sediment and the shallow, sandy bed of the western part of the lake.
The expansive delta and estuary is an oasis for life year round. Hundreds of plant and animal species call it home, including dozens that are threatened or endangered.
Fires and Smoke Engulf Southeastern Australia

A record-setting and deadly fire season marred the beginning of the year in Australia. Residents of the southeastern part of the country told news media about daytime seeming to turn to night, as thick smoke filled the skies and intense fires drove people from their homes.
This natural-color image of Southeastern Australia was acquired on January 4, 2020, by the Moderate Resolution Imaging Spectroradiometer (MODIS) on NASA’s Aqua satellite. The smoke has a tan color, while clouds are bright white. It is likely that some of the white patches above the smoke are pyrocumulonimbus clouds—clouds created by the convection and heat rising from a fire.
Nighttime Images Capture Change in China

A team of scientists from NASA’s Goddard Space Flight Center (GSFC) and Universities Space Research Association (USRA) detected signs of the shutdown of business and transportation around Hubei province in central China. As reported by the U.S. State Department, Chinese authorities suspended air, road, and rail travel in the area and placed restrictions on other activities in late January 2020 in response to the COVID-19 outbreak in the region.
A research team analyzed images of Earth at night to decipher patterns of energy use, transportation, migration, and other economic and social activities. Data for the images were acquired with the Visible Infrared Imaging Radiometer Suite (VIIRS) on the NOAA–NASA Suomi NPP satellite (launched in 2011) and processed by GSFC and USRA scientists. VIIRS has a low-light sensor—the day/night band—that measures light emissions and reflections. This capability has made it possible to distinguish the intensity, types, and sources of lights and to observe how they change.
The Parched Paraná River

Though a seemingly serene oasis from above, there is more to this scene than meets the eye. On July 3, 2020, the Operational Land Imager (OLI) on Landsat 8 captured this false-color image of the river near Rosario, a key port city in Argentina. The combination of shortwave infrared and visible light makes it easier to distinguish between land and water. A prolonged period of unusually warm weather and drought in southern Brazil, Paraguay, and northern Argentina dropped the Paraná River to its lowest water levels in decades. The parched river basin has hampered shipping and contributed to an increase in fire activity in the delta and floodplain.
The drought has affected the region since early 2020, and low water levels have grounded several ships, and many vessels have had to reduce their cargo in order to navigate the river. With Rosario serving as the distribution hub for much of Argentina’s soy and other farm exports, low water levels have caused hundreds of millions of dollars in losses for the grain sector, according to news reports.
Historic Fires Devastate the U.S. Pacific Coast

Climate and fire scientists have long anticipated that fires in the U.S. West would grow larger, more intense, and more dangerous. But even the most experienced among them have been at a loss for words in describing the scope and intensity of the fires burning in West Coast states during September 2020.
Lightning initially triggered many of the fires, but it was unusual and extreme meteorological conditions that turned some of them into the worst conflagrations in the region in decades.
Throughout the outbreak, sensors like the Visible Infrared Imaging Radiometer Suite (VIIRS) and the Ozone Mapping and Profiler Suite (OMPS) on the NOAA-NASA Suomi NPP satellite collected daily images showing expansive, thick plumes of aerosol particles blowing throughout the U.S. West on a scale that satellites and scientists rarely see.
This image shows North America on September 9th, 2020, as a frontal boundary moved into the Great Basin and produced very high downslope winds along the mountains of Washington, Oregon, and California. The winds whipped up the fires, while a pyrocumulus cloud from the Bear fire in California injected smoke high into the atmosphere. The sum of these events was an extremely thick blanket of smoke along the West Coast.
The Sandy Great Bahama Bank

Though the bright blues of island waters are appreciated by many from a sea-level view, their true beauty is revealed when photographed from space. The underwater masterpiece photographed above is composed of sand dunes off the coast of the Bahamas.
The Great Bahama Bank was dry land during past ice ages, but it slowly submerged as sea levels rose. Today, the bank is covered by water, though it can be as shallow as two meters (seven feet) deep in places. The wave-shaped ripples in the image are sand on the seafloor. The curves follow the slopes of the dunes, which were likely shaped by a fairly strong current near the sea bottom. Sand and seagrass are present in different quantities and depths, giving the image it’s striking range of blues and greens.
This image was captured on February 15th, 2020, by Landsat 8, whose predecessor, Landsat 7, was the first land-use satellite to take images over coastal waters and the open ocean. Today, many satellites and research programs map and monitor coral reef systems, and marine scientists have a consistent way to observe where the reefs are and how they are faring.
Painting Pennsylvania Hills

Along with the plentiful harvest of crops in North America, one of the gifts of Autumn is the gorgeous palette of colors created by the chemical transition and fall of leaves from deciduous trees.
The folded mountains of central Pennsylvania were past peak leaf-peeping season but still colorful when the Operational Land Imager (OLI) on the Landsat 8 satellite passed over on November 9, 2020. The natural-color image above shows the hilly region around State College, Pennsylvania overlaid on a digital elevation model to highlight the topography of the area.
The region of rolling hills and valleys is part of a geologic formation known as the Valley and Ridge Province that stretches from New York to Alabama. These prominent folds of rock were mostly raised up during several plate tectonic collisions and mountain-building episodes in the Ordovician Period and later in the creation of Pangea—when what is now North America was connected with Africa in a supercontinent. Those events created the long chain of the Appalachians, one of the oldest mountain ranges in the world.
A Dangerous Storm in the Night

Ominous and looming, a powerful storm hovered off the US coastline illuminated against the dark night hues.
The Visible Infrared Imaging Radiometer Suite (VIIRS) on NOAA-20 acquired this image of Hurricane Laura at 2:20 a.m. Central Daylight Time on August 26, 2020. Clouds are shown in infrared using brightness temperature data, which is useful for distinguishing cooler cloud structures from the warmer surface below. That data is overlaid on composite imagery of city lights from NASA’s Black Marble dataset.
Hurricane Laura was among the ten strongest hurricanes to ever make landfall in the United States. Forecasters had warned of a potentially devastating storm surge up to 20 feet along the coast, and the channel might have funneled that water far inland. It did not. The outcome was also a testament to strong forecasting and communication by the National Hurricane Center and local emergency management authorities in preparing the public for the hazards.
A Windbreak Grid in Hokkaido

From above, the Konsen Plateau in eastern Hokkaido offers a remarkable sight: a massive grid that spreads across the rural landscape like a checkerboard, visible even under a blanket of snow. Photographed by the Operational Land Imager (OLI) on Landsat 8, this man-made design is not only aesthetically pleasing, it’s also an agricultural insulator.
The strips are forested windbreaks—180-meter (590-foot) wide rows of coniferous trees that help shelter grasslands and animals from Hokkaido’s sometimes harsh weather. In addition to blocking winds and blowing snow during frigid, foggy winters, they help prevent winds from scattering soil and manure during the warmer months in this major dairy farming region of Japan.
Shadows from a Solar Eclipse

Formidable, rare, and awe-inspiring — the first and only total solar eclipse of 2020 occurred on December 14, with the path of totality stretching from the equatorial Pacific to the South Atlantic and passing through southern Argentina and Chile as shown in the lower half of the image above. The Advanced Baseline Imager (ABI) on Geostationary Operational Environmental Satellite 16 (GOES-16) captured these images of the Moon’s shadow crossing the face of Earth.
The “path of totality” (umbral path) for the eclipse was roughly 90 kilometers (60 miles) wide and passed across South America from Saavedra, Chile, to Salina del Eje, Argentina. While a total eclipse of the Sun occurs roughly every 18 months, seeing one from any particular location on Earth is rare. On average, a solar eclipse passes over the same parcel of land roughly every 375 years. The next total solar eclipse will occur on December 4, 2021 over Antarctica, and its next appearance over North America is projected for April 8, 2024.
For additional information and a look at more images like these visit NASA’s Earth Observatory.
Make sure to follow us on Tumblr for your regular dose of space: http://nasa.tumblr.com.
Earth Facts that Live Rent-Free in Our Heads
Earth is a big weird planet. With so much going on, it’s easy to forget some of the many, many processes happening here. But at the same time, some stuff is so unexpected and just plain strange that it’s impossible to forget. We asked around and found out lots of people here at NASA have this problem.

Here are some facts about Earth that live rent free in our heads:
Earth has a solid inner core that is almost as hot as the surface of the Sun. Earth’s core gets as high as 9,800 degrees Fahrenheit, while the surface of the Sun is about 10,000 degrees Fahrenheit.

Dust from the Sahara fertilizes the Amazon rainforest. 27.7 million tons blow all the way across the Atlantic Ocean to the rainforest each year, where it brings phosphorus -- a nutrient plants need to grow.

Ice in Antarctica looks solid and still, but it’s actually flowing -- in some places it flows so fast that scientific instruments can move as much as a kilometer (more than half a mile!) a year.

Speaking of Antarctica: Ice shelves (the floating part of ice sheets) can be as big as Texas. Because they float, they rise and fall with the tide. So floating ice as big as Texas, attached to the Antarctic Ice Sheet, can rise and fall up to ~26 feet!

Melting ice on land makes its way to the ocean. As polar glaciers melt, the water sloshes to the equator, and which can actually slow the spin of Earth.

Even though it looks it, the ocean isn’t level. The surface has peaks and valleys and varies due to changes in height of the land below, winds, temperature, saltiness, atmospheric pressure, ocean circulation, and more.

Earth isn’t the only mind-blowing place out there. From here, we look out into the rest of the universe, full of weird planets and galaxies that surprise us.

Make sure to follow us on Tumblr for your regular dose of space: http://nasa.tumblr.com.
One Hot Year after Another
Globally, 2020 was the hottest year on record, effectively tying 2016, the previous record. Overall, Earth’s average temperature has risen more than 2 degrees Fahrenheit since the 1880s.

Temperatures are increasing due to human activities, specifically emissions of greenhouse gases, like carbon dioxide and methane.
Heat and the energy it carries are what drive our planet: winds, weather, droughts, floods, and more are expressions of heat. The right amount of heat is even one of the things that makes life on Earth possible. But too much heat is changing the way our planet’s systems act.
My World’s on Fire
Higher temperatures drive longer, more intense fire seasons. As rain and snowfall patterns change, some regions are getting drier and more vulnerable to damage, setting the stage for more fires.

2020 saw several record-breaking fires, both in Australia in the beginning of the year, and in the western U.S. through northern summer and fall. Smoke from fires in both regions reached so high into the atmosphere that it formed clouds and continues to travel around the globe today.

In the Siberian Arctic, unusually high temperatures helped drive at least 19 fires in the region. More than half of them were burning peat soil -- decomposed organic materials -- that stores a lot of carbon. Peat fires release vast amounts of carbon into the atmosphere, potentially leading to even more warming.

The Water’s Getting Warm
It wasn’t just fire seasons setting records. 2020 had more named tropical storms in the Atlantic and more storms making landfall in the U.S. than any hurricane season on record.

Hurricanes rely on warm ocean water as fuel, and this year, the Atlantic provided. 30 named storms weren’t the only things that made this year’s hurricane season notable.

Storms like Eta, Delta, and Iota quickly changed from smaller, weaker tropical storms into more destructive hurricanes. This rapid intensification is complicated, but it’s likely that warmer, more humid weather -- a result of climate change -- helps drive it.

The Ice Is Getting Thin
Add enough heat, and even the biggest chunk of ice will melt. That’s true whether we’re talking about the ice cubes in your glass or the vast sheets of ice at our planet’s poles. Right now, the Arctic region is warming about three times faster than the rest of our planet, which has some major effects both locally and globally.

This year, Arctic sea ice hit a near-record low. Sea ice is actually made of frozen ocean water, and it grows and thaws with the seasons, typically reaching an annual minimum extent in September.

Warmer ocean water led to more ice melting this year, and 2020’s annual minimum extent continued a long trend of shrinking Arctic sea ice extent.
A Long Trend
We study Earth and how it’s changing from the ground, the sky, and space. Using data from sensors all around the planet, we calculate the global average temperature, working with our partners at NOAA.
Many other organizations also track global temperature using their own instruments and methods, and they all match remarkably well. The last seven years were the hottest seven years on record. Earth is getting warmer.

We also study the effects of increasing temperatures, like the melting sea ice and longer fire seasons mentioned above. Additionally, we can study the cause of climate change from space, with a bird’s eye view of increasing carbon in the atmosphere.

The planet is changing because of human activities. We’re working together with other agencies to monitor changes and understand what this means for people in the future.
Make sure to follow us on Tumblr for your regular dose of space: http://nasa.tumblr.com.
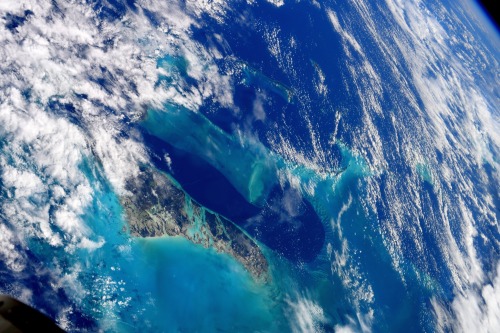
Question: would you rather be on the beach or would you rather gawk at it from space? For some, it’s a tough choice.
Astronaut Soichi Noguchi of the Japan Space Agency recently took this image of Andros Island, the largest island in the Bahamas. He and his three crew mates, NASA astronauts Victor Glover, Mike Hopkins and Shannon Walker, are currently living and working aboard the International Space Station for a six-month science mission. The crew launched on Nov. 15 from Kennedy Space Center and are conducting a number of scientific research, including Earth observation.
Every 90 minutes, the International Space Station completes one orbit around Earth. Because Earth rotates below them while they orbit, the crew get to see most of their beautiful blue marble of a planet from the unique vantage point of space. By photographing Earth from about 250 miles above the surface, astronauts can record phenomena such as storms in real time, and even provide input to ground teams. Make sure to follow us on Tumblr for your regular dose of space: http://nasa.tumblr.com.
Get to Know the 5 College Teams Sending Their Experiments to Space!
Did you know that YOU (yes you!), can send science experiments to the International Space Station?
To celebrate 20 years of continuous human presence on the International Space Station, NASA STEM on Station is sending five student experiments to the space station through Student Payload Opportunity with Citizen Science (SPOCS). Selected teams will also engage K-12 students as a part of their experiment through citizen-science.
Get to know the 5 college teams sending their experiments to space!
Arkansas State University
Team: A-State Science Support System

Experiment Title: Microgravity Environment Impact on Plastic Biodegradation by Galleria mellonella
Experiment Description: Discover the ability of wax worms to degrade plastics in space.
Why did you propose this experiment?
Our team’s passion for sustainability developed into novel ideas for space travel through biodegradation of plastics.
How will the experiment benefit humankind or future space exploration?
If our experiment is successful, it will “launch” us closer to understanding how to reduce humankind’s plastic footprint on Earth and allow us to safely push farther into unknown planetary habitats.
How have you worked together as a team during the pandemic?
Unknown to each other before the project, our interdisciplinary team formed through virtual communication.
What science fiction character best represents your team and why?
The sandworms of Dune represent our team perfectly considering their importance in space travel, the natural ecological service they provide, and their sheer awesomeness
Columbia University
Team: Columbia Space Initiative

Experiment Title: Characterizing Antibiotic Resistance in Microgravity Environments (CARMEn)
Experiment Description: Discover the impact of mutations on bacteria in microgravity when grown into a biofilm with fungus.
Why did you propose this experiment?
As a highly interdisciplinary team united by our love of outer space, SPOCS was the perfect opportunity to fuse biology, engineering, and education into a meaningful team project.
How will the experiment benefit humankind or future space exploration?
Studying how different microorganisms interact with each other to develop bacterial resistance in space will help improve antibiotic treatments for future Artemis astronauts.
How have you worked together as a team during the pandemic?
Most of our team actually hasn’t ever met in person—we’ve been videoconferencing weekly since May!
What science fiction character best represents your team and why?
Our team is definitely Buzz Lightyear from Toy Story, because we strive to reach infinity (or at least the International Space Station) and beyond!
Stanford University
Team: Stanford Student Space Initiative

Experiment Title: Biopolymer Research for In-Situ Capabilities (BRIC)
Experiment Description: Determine how microgravity impacts the solidification of biobricks.
Why did you propose this experiment?
We have an ongoing project to design and build a machine that turns lunar or Martian soil into bricks, and we want to learn how reduced gravity will impact the process.
How will the experiment benefit humankind or future space exploration?
We are studying an environmentally-friendly concrete alternative that can be used to make structures on Earth and other planets out of on-site, readily available resources.
How have you worked together as a team during the pandemic?
We transitioned our weekly meetings to an online format so that we could continue at our planned pace while maintaining our community.
What science fiction character best represents your team and why?
Like our beloved childhood friend WALL-E, we craftily make inhospitable environments suitable for life with local resources.
University of Idaho
Team: Vandal Voyagers I

Experiment Title: Bacteria Resistant Polymers in Microgravity
Experiment Description: Determine how microgravity impacts the efficacy of bacteria resistant polymers.
Why did you propose this experiment?
The recent emphasis on surface sterility got us thinking about ways to reduce the risk of disease transmission by surfaces on the International Space Station.
How will the experiment benefit humankind or future space exploration?
If successful, the application of proposed polymers can benefit humankind by reducing transmission through high contact surfaces on and off Earth such as hand rails and door handles.
How have you worked together as a team during the pandemic?
We are allowed to work collaboratively in person given we follow the current university COVID guidelines.
What science fiction character best represents your team and why?
Mark Watney from The Martian because he is willing to troubleshoot and problem solve on his own while collaborating with NASA from afar.
University of New Hampshire at Manchester
Team: Team Cooke

Experiment Title: Novel Methods of Antibiotic Discovery in Space (NoMADS)
Experiment Description: Determine how microgravity impacts the amount of bacterium isolates that produce antibiotic metabolites.
Why did you propose this experiment?
To contribute to the limited body of knowledge regarding bacterial resistance and mutations in off-Earth conditions.
How will the experiment benefit humankind or future space exploration?
Understanding how bacteria in the human microbiome and on spacecraft surfaces change can ensure the safe and accurate treatment of bacterial infections in astronauts.
How have you worked together as a team during the pandemic?
Our team continued to evolve our communication methods throughout the pandemic, utilizing frequent remote video conferencing, telecommunications, email, and in-person conferences.
What science fiction character best represents your team and why?
Professor Xavier, the founder of the X-Men, because he also works with mutants and feels that while they are often misunderstood, under the right circumstances they can greatly benefit the world.
Make sure to follow us on Tumblr for your regular dose of space: http://nasa.tumblr.com.
Dreaming of going to space? – Astronaut Victor Glover has you covered.
In his first video from space, take a look at our home through the window of SpaceX’s Crew Dragon “Resilience” spacecraft. Victor arrived to the International Space Station alongside his fellow Crew-1 astronauts on Nov. 16, 2020.
This is his first trip to space and his first mission on the orbital lab!
Follow his Instagram account HERE to stay up-to-date on station life and for more behind-the-scenes content like this.
Make sure to follow us on Tumblr for your regular dose of space: http://nasa.tumblr.com.

Check out tiny-house-looking satellite Sentinel-6 Michael Freilich
It might look like something you’d find on Earth, but this piece of technology has a serious job to do: track global sea level rise with unprecedented accuracy. It’s #SeeingTheSeas mission will:
Provide information that will help researchers understand how climate change is reshaping Earth's coastlines – and how fast this is happenin.
Help researchers better understand how Earth's climate is changing by expanding the global atmospheric temperature data record
Help to improve weather forecasts by providing meteorologists information on atmospheric temperature and humidity.
Tune in tomorrow, Nov. 21 at 11:45 a.m. EST to watch this U.S.-European satellite launch to space! Liftoff is targeted for 12:17 p.m. EST. Watch HERE.
Make sure to follow us on Tumblr for your regular dose of space: http://nasa.tumblr.com.
What Would These Astronauts Put in Their #NASAMoonKit?

NASA is hard at work to land the first woman and the next man on the Moon, and we want to know: what would you pack for a trip to the Moon?
We will be soon conducting our last in a series of Green Run tests for the core stage of our Space Launch System (SLS) — the most powerful rocket ever built.
The series of tests is designed to gradually bring the rocket stage and all its systems to life for the first time — ensuring that it’s ready for missions to the Moon through the Artemis program.
To mark this critical time in the history of American spaceflight, we’ve been asking people like you — what would you take with you on a trip to the Moon? Social media users have been regaling us with their images, videos, and illustrations with the hashtag #NASAMoonKit!
Looking for a little inspiration? We asked some of our astronauts and NASA leaders the same question:
1. NASA Astronaut Chris Cassidy

NASA astronaut Chris Cassidy recently took this photo from the International Space Station and posted it to his Twitter account with this caption:
“If I was on the next mission to the Moon, I would have to bring this tiny spaceman with me! He’s flown with me on all of my missions and was in my uniform pocket for all the SEAL missions I have been a part of. Kind of like a good luck charm.”
2. European Space Agency Astronaut Tim Peake

European Space Agency astronaut Tim Peake asked his two sons what they would take with them to the Moon. This is what they decided on!
3. NASA Astronaut Scott Tingle
Based on previous missions to space, NASA astronaut Scott Tingle would put a can of LiOH, or Lithium Hydroxide, into his #NASAMoonKit.
A LiOH can pulls carbon dioxide out of the air — very important when you're in a closed environment for a long time! Apollo 13 enthusiasts will remember that the astronauts had to turn off their environmental system to preserve power. To keep the air safe, they used LiOH cans from another part of the vehicle, but the cans were round and the fitting was square. Today we have interoperability standards for space systems, so no more square pegs in round holes!
4. NASA Astronaut Drew Morgan

NASA astronaut Drew Morgan received some feedback from his youngest daughter when she was in kindergarten about she would put into her #NASAMoonKit.
5. Head of Human Spaceflight Kathy Lueders

Although Kathy Lueders is not an astronaut, she is the head of human spaceflight at NASA! Her #NASAMoonKit includes activities to keep her entertained as well as her favorite pillow.
6. NASA Astronaut Kenneth Bowersox

NASA astronaut Kenneth Bowersox knows from his past space shuttle experience what the “perfect space food” is — peanut butter. He would also put a hooded sweatshirt in his #NASAMoonKit, for those long, cold nights on the way to the Moon.
7. NASA Astronaut Michael Collins

NASA astronaut Michael Collins has actually made a real-life #NASAMoonKit — when he flew to the Moon on the Apollo 11 mission! But for this time around, he tweeted that would like to bring coffee like he did the first time — but add on a good book.
How to Show Us What’s In Your #NASAMoonKit:
There are four social media platforms that you can use to submit your work:
Instagram: Use the Instagram app to upload your photo or video, and in the description include #NASAMoonKit
Twitter: Share your image on Twitter and include #NASAMoonKit in the tweet
Facebook: Share your image on Facebook and include #NASAMoonKit in the post
Tumblr: Share your image in Tumblr and include #NASAMoonKit in the tags
If your #NASAMoonKit catches our eye, we may share your post on our NASA social media accounts or share it on the Green Run broadcast!
Click here for #NASAMoonKit Terms and Conditions.
Make sure to follow us on Tumblr for your regular dose of space: http://nasa.tumblr.com
What did you major in? What was your college experience?
More than Just Dust in the Wind

From space, we can see a swirling brown mass making its way across the Atlantic – dust from the Sahara Desert – the largest hot desert in the world. It’s a normal phenomenon. Every year, winds carry millions of tons of dust from North Africa, usually during spring and summer in the Northern Hemisphere.

June 2020 has seen a massive plume of dust crossing the ocean. It’s so large it’s visible from one million miles away in space.

Dust clouds this large can affect air quality in regions where the dust arrives. The particles can also scatter the Sun’s light, making sunrises and sunsets more vibrant.

Dust particles in the air are also known as aerosols. We can measure aerosols, including dust, sea salt and smoke, from satellites and also use computer models to study how they move with the wind.

Following the transport of dust from space shows us how one of the driest places on Earth plays a role in fertilizing the Amazon rainforest. There are minerals in Saharan dust, like phosphorous, that exist in commercial fertilizers, helping seed the rainforest.
Make sure to follow us on Tumblr for your regular dose of space: http://nasa.tumblr.com
Earth’s Land Ice by the Numbers
“At a glacial pace” used to mean moving so slowly the movement is almost imperceptible. Lately though, glaciers are moving faster. Ice on land is melting and flowing, sending water to the oceans, where it raises sea levels.

In 2018, we launched the Ice, Cloud and Land Elevation Satellite-2 (ICESat-2) to continue a global record of ice elevation. Now, the results are in. Using millions of measurements from a laser in space and quite a bit of math, researchers have confirmed that Earth is rapidly losing ice.
16 Years

ICESat-2 was a follow-up mission to the original ICESat, which launched in 2003 and took measurements until 2009. Comparing the two records tells us how much ice sheets have lost over 16 years.

½ Inch
During those 16 years, melting ice from Antarctica and Greenland was responsible for just over a half-inch of sea level rise. When ice on land melts, it eventually finds its way to the ocean. The rapid melt at the poles is no exception.

400,000 Olympic Swimming Pools
One gigaton of ice holds enough water to fill 400,000 Olympic swimming pools. It’s also enough ice to cover Central Park in New York in more than 1,000 feet of ice.

200 Gigatons
Between 2003 and 2019, Greenland lost 200 gigatons of ice per year. That’s 80 million Olympic swimming pools reaching the ocean every year, just from Greenland alone.

118 Gigatons
During the same time period, Antarctica lost 118 gigatons of ice per year. That’s another 47 million Olympic swimming pools every year. While there has been some elevation gain in the continent’s center from increased snowfall, it’s nowhere near enough to make up for how much ice is lost to the sea from coastal glaciers.

10,000 Pulses
ICESat-2 sends out 10,000 pulses of laser light a second down to Earth’s surface and times how long it takes them to return to the satellite, down to a billionth of a second. That’s how we get such precise measurements of height and changing elevation.

These numbers confirm what scientists have been finding in most previous studies and continue a long record of data showing how Earth’s polar ice is melting. ICESat-2 is a key tool in our toolbox to track how our planet is changing.
Make sure to follow us on Tumblr for your regular dose of space: http://nasa.tumblr.com.
Earth’s Land Ice by the Numbers
“At a glacial pace” used to mean moving so slowly the movement is almost imperceptible. Lately though, glaciers are moving faster. Ice on land is melting and flowing, sending water to the oceans, where it raises sea levels.

In 2018, we launched the Ice, Cloud and Land Elevation Satellite-2 (ICESat-2) to continue a global record of ice elevation. Now, the results are in. Using millions of measurements from a laser in space and quite a bit of math, researchers have confirmed that Earth is rapidly losing ice.

16 Years
ICESat-2 was a follow-up mission to the original ICESat, which launched in 2003 and took measurements until 2009. Comparing the two records tells us how much ice sheets have melted over 16 years.

½ Inch
During those 16 years, melting ice from Antarctica and Greenland was responsible for just over a half-inch of sea level rise. When ice on land melts, it eventually finds its way to the ocean. The rapid melt at the poles is no exception.

400,000 Olympic Swimming Pools
One gigaton of ice holds enough water to fill 400,000 Olympic swimming pools. It’s also enough ice to cover Central Park in New York in more than 1,000 feet of ice.

200 Gigatons
Between 2003 and 2019, Greenland lost 200 gigatons of ice per year. That’s 80 million Olympic swimming pools reaching the ocean every year, just from Greenland alone.

118 Gigatons
During the same time period, Antarctica lost 118 gigatons of ice per year. That’s another 47 million Olympic swimming pools every year. While there has been some elevation gain in the continent’s center from increased snowfall, it’s nowhere near enough to make up for how much ice is lost to the sea from coastal glaciers.

10,000 Pulses
ICESat-2 sends out 10,000 pulses of laser light a second down to Earth’s surface and times how long it takes them to return to the satellite, down to a billionth of a second. That’s how we get such precise measurements of height and changing elevation.

These numbers confirm what scientists have been finding in most previous studies and continue a long record of data showing how Earth’s polar ice is melting. ICESat-2 is a key tool in our toolbox to track how our planet is changing.
Make sure to follow us on Tumblr for your regular dose of space: http://nasa.tumblr.com.
21 Years of Amazing Earth Imagery
On April 29, 1999, NASA Earth Observatory started delivering science stories and imagery to the public through the Internet. Today, we turn 21! So much has changed in the past two decades...
One of the most notable changes is the way we view our home planet. Check out some of the beautiful imagery of our planet over the past 21 years.
2000: Pine Island Glacier

Most people will never see Pine Island Glacier in person. Located near the base of the Antarctic Peninsula—the “thumb” of the continent—the glacier lies more than 2,600 kilometers (1,600 miles) from the tip of South America. That’s shorter than a cross-country flight from New York to Los Angeles, but there are no runways on the glacier and no infrastructure. Only a handful of scientists have ever set foot on its ice.
This animation shows a wide view of Pine Island Glacier and the long-term retreat of its ice front. Images were acquired by the Moderate Resolution Imaging Spectroradiometer (MODIS) on our Terra satellite from 2000 to 2019. Notice that there are times when the front appears to stay in the same place or even advance, though the overall trend is toward retreat. Read more.
2002: The Blue Marble

In February 2002, Earth Observatory published this “blue marble” image based on the most detailed collection of true-color imagery of the entire Earth at that time. Using a collection of satellite-based observations, scientists and visualizers stitched together months of observations of the land surface, oceans, sea ice and clouds into a seamless, true-color mosaic of every square kilometer (.386 square mile) of our planet. Most of the information contained in this image came from Moderate Resolution Imaging Spectrometer (MODIS), illustrating the instrument's outstanding capacity to act as an integrated tool for observing a variety of terrestrial, oceanic and atmospheric features of the Earth. Read more.
2009: Tsauchab River Bed

The Tsauchab River is a famous landmark for the people of Namibia and tourists. Yet few people have ever seen the river flowing with water. In December 2009, an astronaut on the International Space Station caught this glimpse of the Tsauchab River bed jutting into the sea of red dunes. It ends in a series of light-colored, silty mud holes on the dry lake floor.
Like several other rivers around the Namib Desert, the Tsauchab brings sediment down from the hinterland toward the coastal lowland. This sediment is then blown from the river beds, and over tens of millions of years it has accumulated as the red dunes of the Namib Sand Sea. Read more.
2012: Manning Island and Foxe Basin, Canada

Although it may look like a microscope’s view of a thin slice of mineral-speckled rock, this image was actually acquired in space by the Earth Observing-1 satellite in July 2012. It shows a small set of islands and a rich mixture of ice in Foxe Basin, the shallow northern reaches of Hudson Bay.
The small and diverse sizes of the ice floes indicate that they were melting. The darkest colors in the image are open water. Snow-free ice appears gray, while snow-covered ice appears white. The small, dark features on many of the floes are likely melt ponds. Read more.
2013: A Lava Lamp Look at the Atlantic

Stretching from tropical Florida to the doorstep of Europe, this river of water carries a lot of heat, salt, and history. The Gulf Stream is an important part of the global ocean conveyor belt that moves water and heat across the North Atlantic from the equator toward the poles. It is one of the strongest currents on Earth, and one of the most studied.
This image shows a small portion of the Gulf Stream as it appears in infrared imagery. Data for this image was acquired on April 9, 2013, by the Thermal Infrared Sensor (TIRS) on the Landsat 8 satellite. TIRS observes in wavelengths of 10.9 micrometers and 12.0 micrometers. The image above is centered at 33.06° North latitude, 73.86° West longitude, about 500 kilometers (300 miles) east of Charleston, South Carolina. Read more.
2016: Curious Ensemble of Wonderful Features

When John Wesley Powell explored the Colorado River in 1869, he made the first thorough survey of one of the last blank spots on the map. The expedition began in May at Green River, Wyoming, and ended three months later at the confluence of the Colorado and Virgin Rivers in present-day Nevada.
About two months into their journey, the nine men of the expedition found themselves in Glen Canyon. As the men traveled along the serpentine river channel, they encountered what Powell later described in Canyons of Colorado as a “curious ensemble of wonderful features.”
From above, the view of Glen Canyon is equally arresting. In 2016, an astronaut aboard the International Space Station took several photographs that were combined to make a long mosaic. The water has an unnatural shade of blue because of sunglint, an optical phenomenon that occurs when sunlight reflects off the surface of water at the same angle that a camera views it. Click here to see the long mosaic.
2019: Lena Delta Shakes Off Water

For most of the year, the Lena River Delta—a vast wetland fanning out from northeast Siberia into the Arctic Ocean—is either frozen over and barren or thawed out and lush. Only briefly will you see it like this.
After seven months encased in snow and ice, the delta emerges for the short Arctic summer. The transition happens fast. The animation above, composed of images from the Moderate Resolution Imaging Spectroradiometer (MODIS) on our Aqua satellite, shows the transformation from June 3-10, 2019. Read more.
2020: Making Waves in the Andaman Sea

When tides, currents and gravity move water masses over seafloor features, they can create wave actions within the ocean. Oceanographers began studying these internal waves from ships in the 1960s, and the modern era of satellites has made it possible to see them on a grand scale. The Operational Land Imager (OLI) on Landsat 8 captured these images of the Andaman Sea on November 29, 2019. The reflection of the Sun on the ocean—sunglint—helps make the internal waves visible.
Internal waves form because the ocean is layered. Deep water tends to be colder, denser and saltier, while shallower water is often warmer, lighter and fresher. The differences in density and salinity cause layers of the ocean to behave like different fluids. When tides, currents, gravity and Earth’s rotation move these different water masses over seafloor formations (such as ridges or canyons), they create waves within the sea. Read more.
These images were taken from NASA Earth Observatory!
Interested in receiving Earth Observatory's Images of the Day? Subscribe to our newsletters or RSS feeds.
Make sure to follow us on Tumblr for your regular dose of space: http://nasa.tumblr.com.
Game Time: Final Voting for Tournament Earth
The moment has arrived- it's time to decide the NASA Earth Observatory's all-time best image. After four grueling rounds of voting, two contenders remain: Ocean Sand, Bahamas (#5 seed) versus Raikoke Erupts (#6 seed).

The road to the finals has been full of surprises. All top seeds have been knocked out. In one semifinal, Ocean Sand garnered 50.6 percent of the votes to squeak out a win over the overall favorite, Twin Blue Marbles. In the other matchup, Raikoke Erupts trounced Where the Dunes End, 66.5 to 33.5 percent.
Now you have to pick a champion. Will it be a gorgeous, artistic image from the very early years of Earth Observatory or stunning natural-color views of an explosive event from 2019? Which image will you crown as the best in the EO archives: Ocean Sand, Bahamas or Raikoke Erupts? Voting ends on April 28 at 9 a.m. U.S. Eastern Time.
Thank you for helping us celebrate Earth Observatory’s 20th anniversary and the 50th anniversary of Earth Day!
Vote here: https://earthobservatory.nasa.gov/tournament-earth
Make sure to follow us on Tumblr for your regular dose of space: http://nasa.tumblr.com.

That’s a wrap! Thank you all so much for your awesome questions!
If you’re looking for other ways to enjoy #EarthDayatHome, check out this feature: https://www.nasa.gov/feature/goddard/2020/earthdayathome-with-nasa/
Don’t forget to follow NASA Earth on Twitter, Facebook and Instagram.
You can follow Sandra Cauffman on Twitter, HERE.
You can follow Dr. Thomas Zurbuchen “Dr. Z” on Twitter, HERE.
Happy Earth Day!
How is it like to be a NASA Earth Scientist? What Subjects are you required to excel at to become one? Were you really good in your studies, when you were a young teenager?
What are the different fields of Earth Science? Are they related to each other?
What’s your favorite geological feature to view from space? Alternatively, what’s the biggest “duh” moment you’ve had during your career where you had an incorrect, preconceived notion about something. Thanks!
When you first saw Earth from all the way up in space, what were your first thoughts? Did it change the way you viewed things?
What ways were used to determine all of the inner workings under our planet Earth’s surface?
Whats the coolest thing u have seen or discovered???!!!! Like i mean cool as in something that made u nerd out! I used to want to work for nasa but found a love for teaching art instead so i find myself nersing out over the cool research yall put out! Much love from wise county texas!
In recent years of tracking weather activity and the like, have there been more 'anomolies' that have stuck out more than others? (I.E hurricanes, typhoons or cyclones that start out as small storms then become hurricane 4-5 storms in a matter of days-weeks) I think what you guys are doing is awesome and keep up the good work ~TKL
How did you decide to scientist? How you start works? And what did you do for that ?
Question: How did you decide to be a scientist? How did you start work? And what did you do for that?
Hi there! Does the study of Earth Science teach us much about the science of other planets? Can much be assumed to be similar, or is the geology/biology incomparable? Thank you!
Are the rumors about the ozone layer being totally fixed true ? If yes , is it susceptible of being opened again ans if no, is it suspecte
Has the COVID-19 pandemic really reduced pollution in areas participating in lockdowns? Is the environment “recovering”?
How do you guys help with climate change?
Hello! I have always wondered about how the clouds work, it seems like they are just gas in the air, but what makes them appear so often? Or how do they form? And how and why do the block out the sun if they're just air?